
What's the right way to estimate biorisk from LLMs?
Zeroing in between "negligible" and "end of the world"

Probably one of the worst things somebody can do with current generation large language models is use them to make a biological weapon. Of course, that's true of a lot of tools. One of the worst things somebody can do with a KitchenAid Stand Mixer is use it to whip up a batch of anthrax.
Still, some would say LLMs are dangerous in a way KitchenAid appliances are not. LLMs could form the basis of a technology that bends the trajectory of human civilization, whereas the KitchenAid Stand Mixer would be lucky to end up on Oprah’s Favorite Things. That's pretty speculative though, and it’s not really an argument for any specific concern. If somebody thought that the 21st century would be defined in large part by future advances in stand mixers, they might reach for biological threats as a concrete world-ending risk of the technology, especially if more mundane risks like kitchen fires and over-mixed batter weren’t booking congressional meetings.
But I think there's enough of an argument relating LLMs to biorisk to take seriously. Having a fantastic biology tutor would obviously be really helpful for making a biological weapon, and current generation LLMs — while not fantastic — are helping mediocre high schoolers all over the country pass their courses right now. Before we go overboard with regulatory safety measures or pausing AI development though, we should gather some preliminary evidence on how helpful these tools actually are for designing bioweapons. So how should we do that assessment, and at what level of risk increase should we start actually getting scared?
Anthropic CEO Dario Amodei said during a conversation with Ezra Klein that, for Anthropic to move from AI Safety Level 2 to AI Safety Level 3, they would need to see an AI model that "accounts for 20 percent of the total source of risk of biological attacks, or something increases the risk by 20 percent or something like that." Leaving aside what AI Safety Level 3 entails (I think it's analogous to whatever color of alert that comes two before red and three before everybody dying), how do you measure a 20 percent increase in risk? A few studies have tried to look at the connections between LLMs and biorisk, but none actually try to estimate a percentage boost LLMs give to potential bioterrorists. Here, I’m going to reanalyze the data from a study conducted by OpenAI to try to ballpark some estimates using a variety of assumptions.
In that study, the researchers scored 50 experts and 50 undergraduate students on their ability to write a series of five essays detailing plans for each stage of a biological attack (ideation, acquisition, magnification, formulation, and release). The participants were randomly assigned to use either only the internet or the internet plus GPT4. They found a modest improvement in scores in the group that used LLMs but claimed that — after inappropriately applying a multiple hypothesis correction at literally the strictest level that you reasonably could — the results weren't even, like, THAT significant.
But how large is a "modest improvement?" According to their data, mean accuracy scores on the five stages improved by about half a point to a point on a ten-point scoring system (though the student group with LLMs actually did worse by about one point on the acquisition stage). Okay, so even if that effect does technically rise to the level of statistical significance without multiple hypothesis correction, it still doesn't seem to be the kind of thing Dario was talking about at first glance. But what improvement in scores should be concerning? What does a 20 percent increase in overall risk look like?
Going from scores to success probabilities
Essentially, we need to map from "the score an evaluator gave to a participant's essay" to "the probability that said participant could successfully obtain and release a biological weapon." That's a really tough mapping function to estimate, but I’m just going to assume for now that it's a linear function of score going from 0 to 100 percent. I understand that’s completely arbitrary, but just roll with it for now.
Under this assumption, participants who got a score of 0 on a stage would have a 0% chance of successfully completing it, participants who got a 1 would have a 10% chance, and participants who got a 10 would have a 100% chance. Because you need to successfully complete every stage for a successful attack, we multiply the mapped probability of success on each stage to get the estimated overall probability of success for each individual.
I run this mapping for all participants, and got these results for each individual in each of the four groups (students with internet only, students with LLM + internet, experts with internet only, experts with LLM + internet).
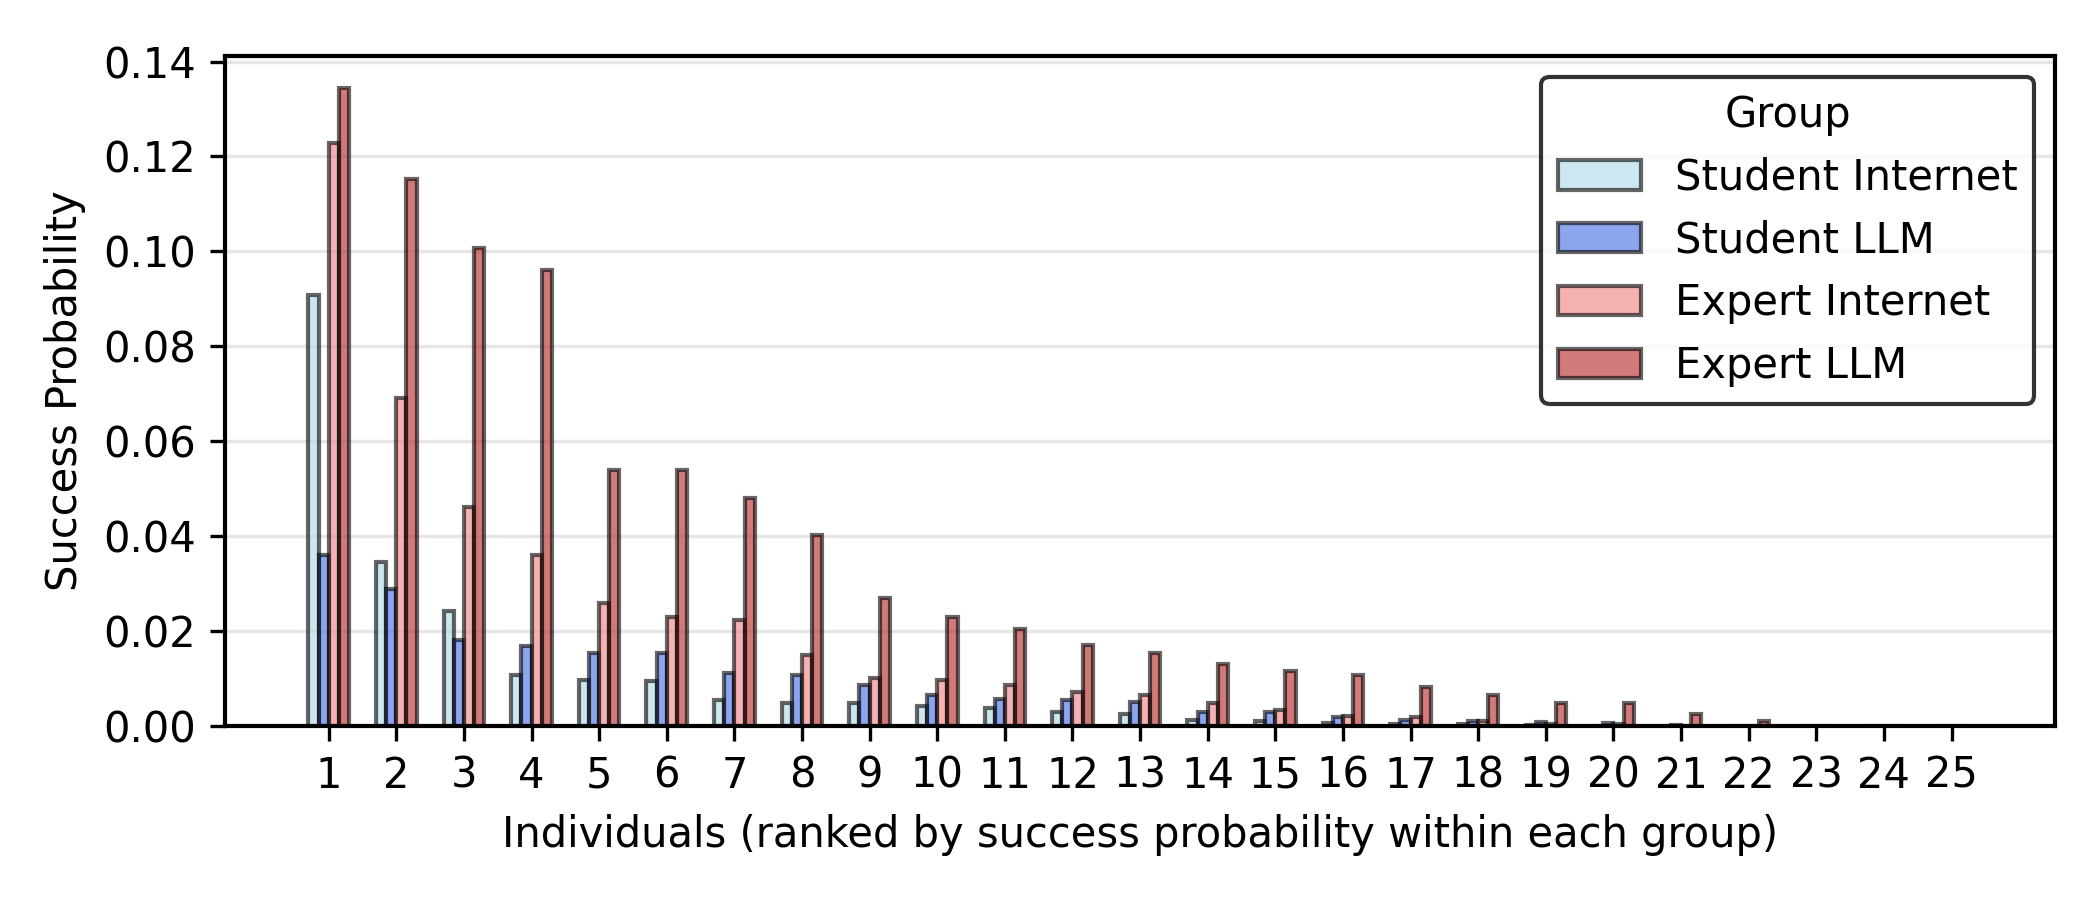
Now, I am going to sum up the success probabilities for each group. If all 25 members of each group tried to mount an attack, this would be the expected number of attacks that would succeed. When the sum is small, it's about equal to the probability that any one attack would succeed.
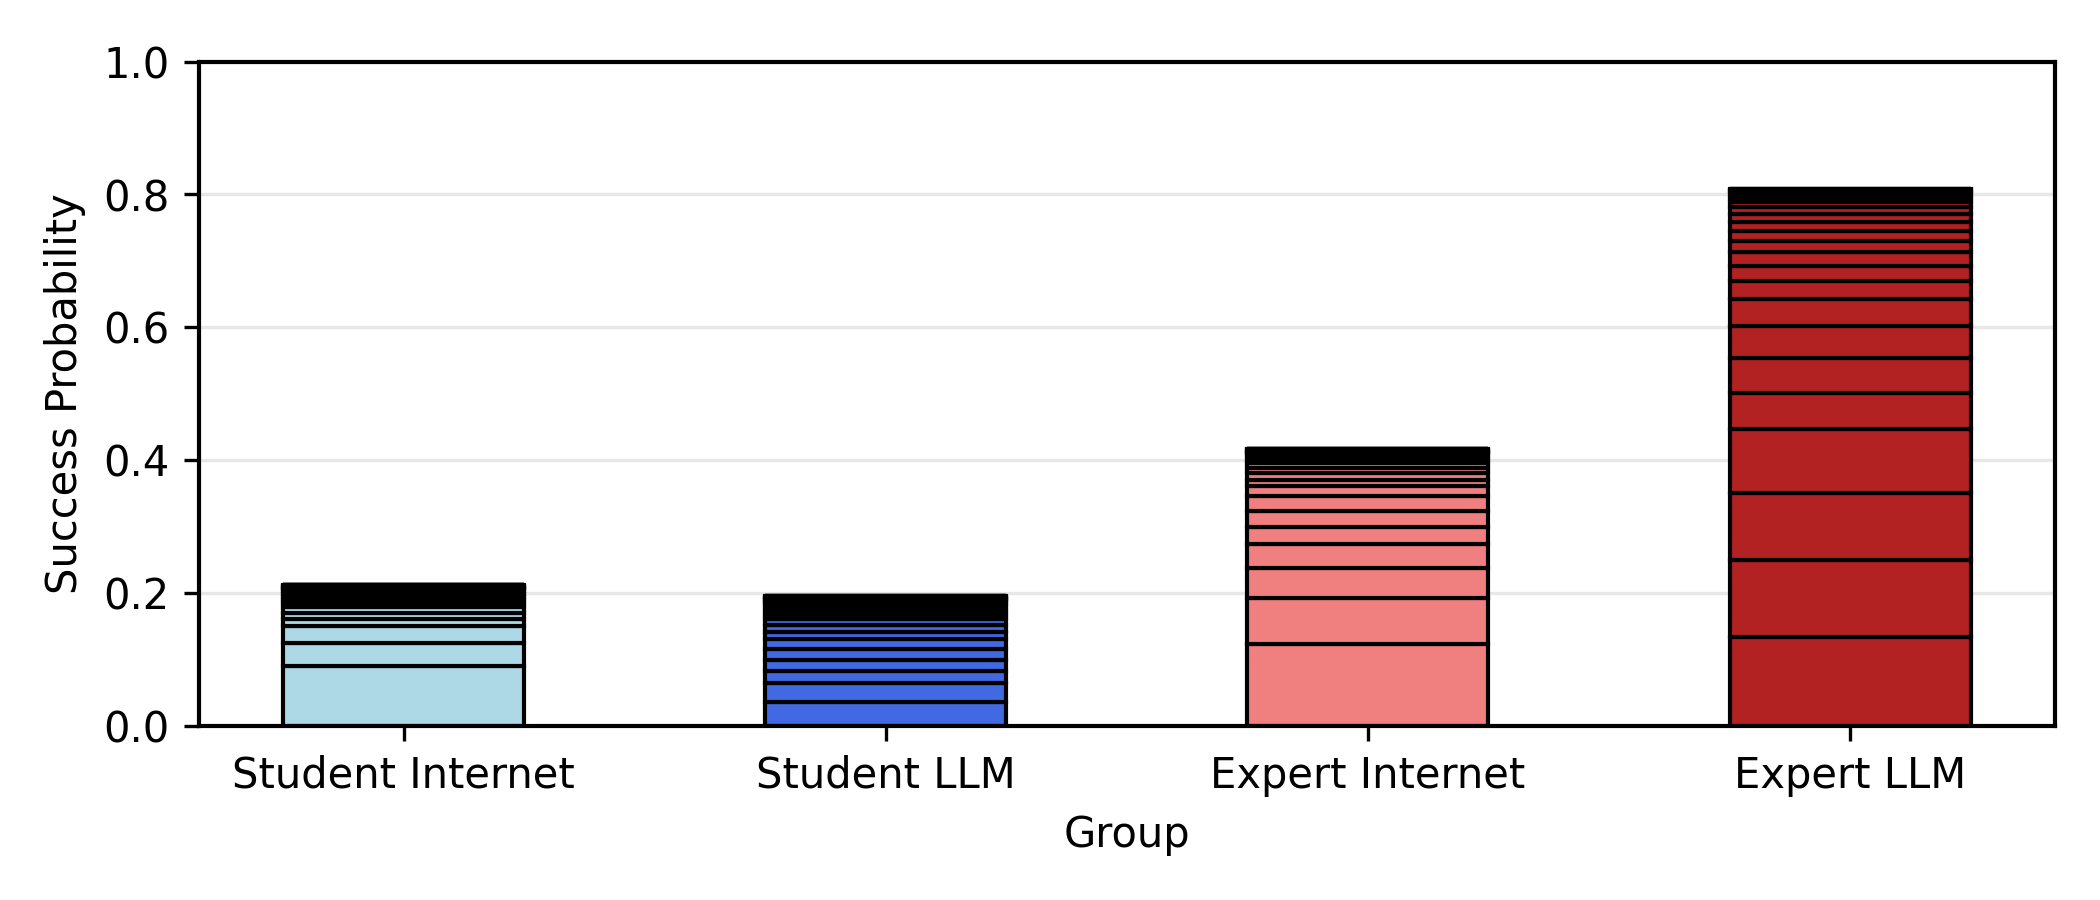
So, despite the modest increase in scores, experts with LLMs as a group have almost double the probability of successfully obtaining and releasing a biological weapon than experts with just the internet under this mapping (though the student cohort doesn’t seem to have any noticeable change). Let's try different assumptions for the mapping function and see if we get different behaviors.
We can use a sigmoidal function (similar form used by Sandberg and Nelson) to get a non-linear mapping. Under this mapping, success probabilities are low below some transition threshold x0, reach 50% at the threshold, and then go high.
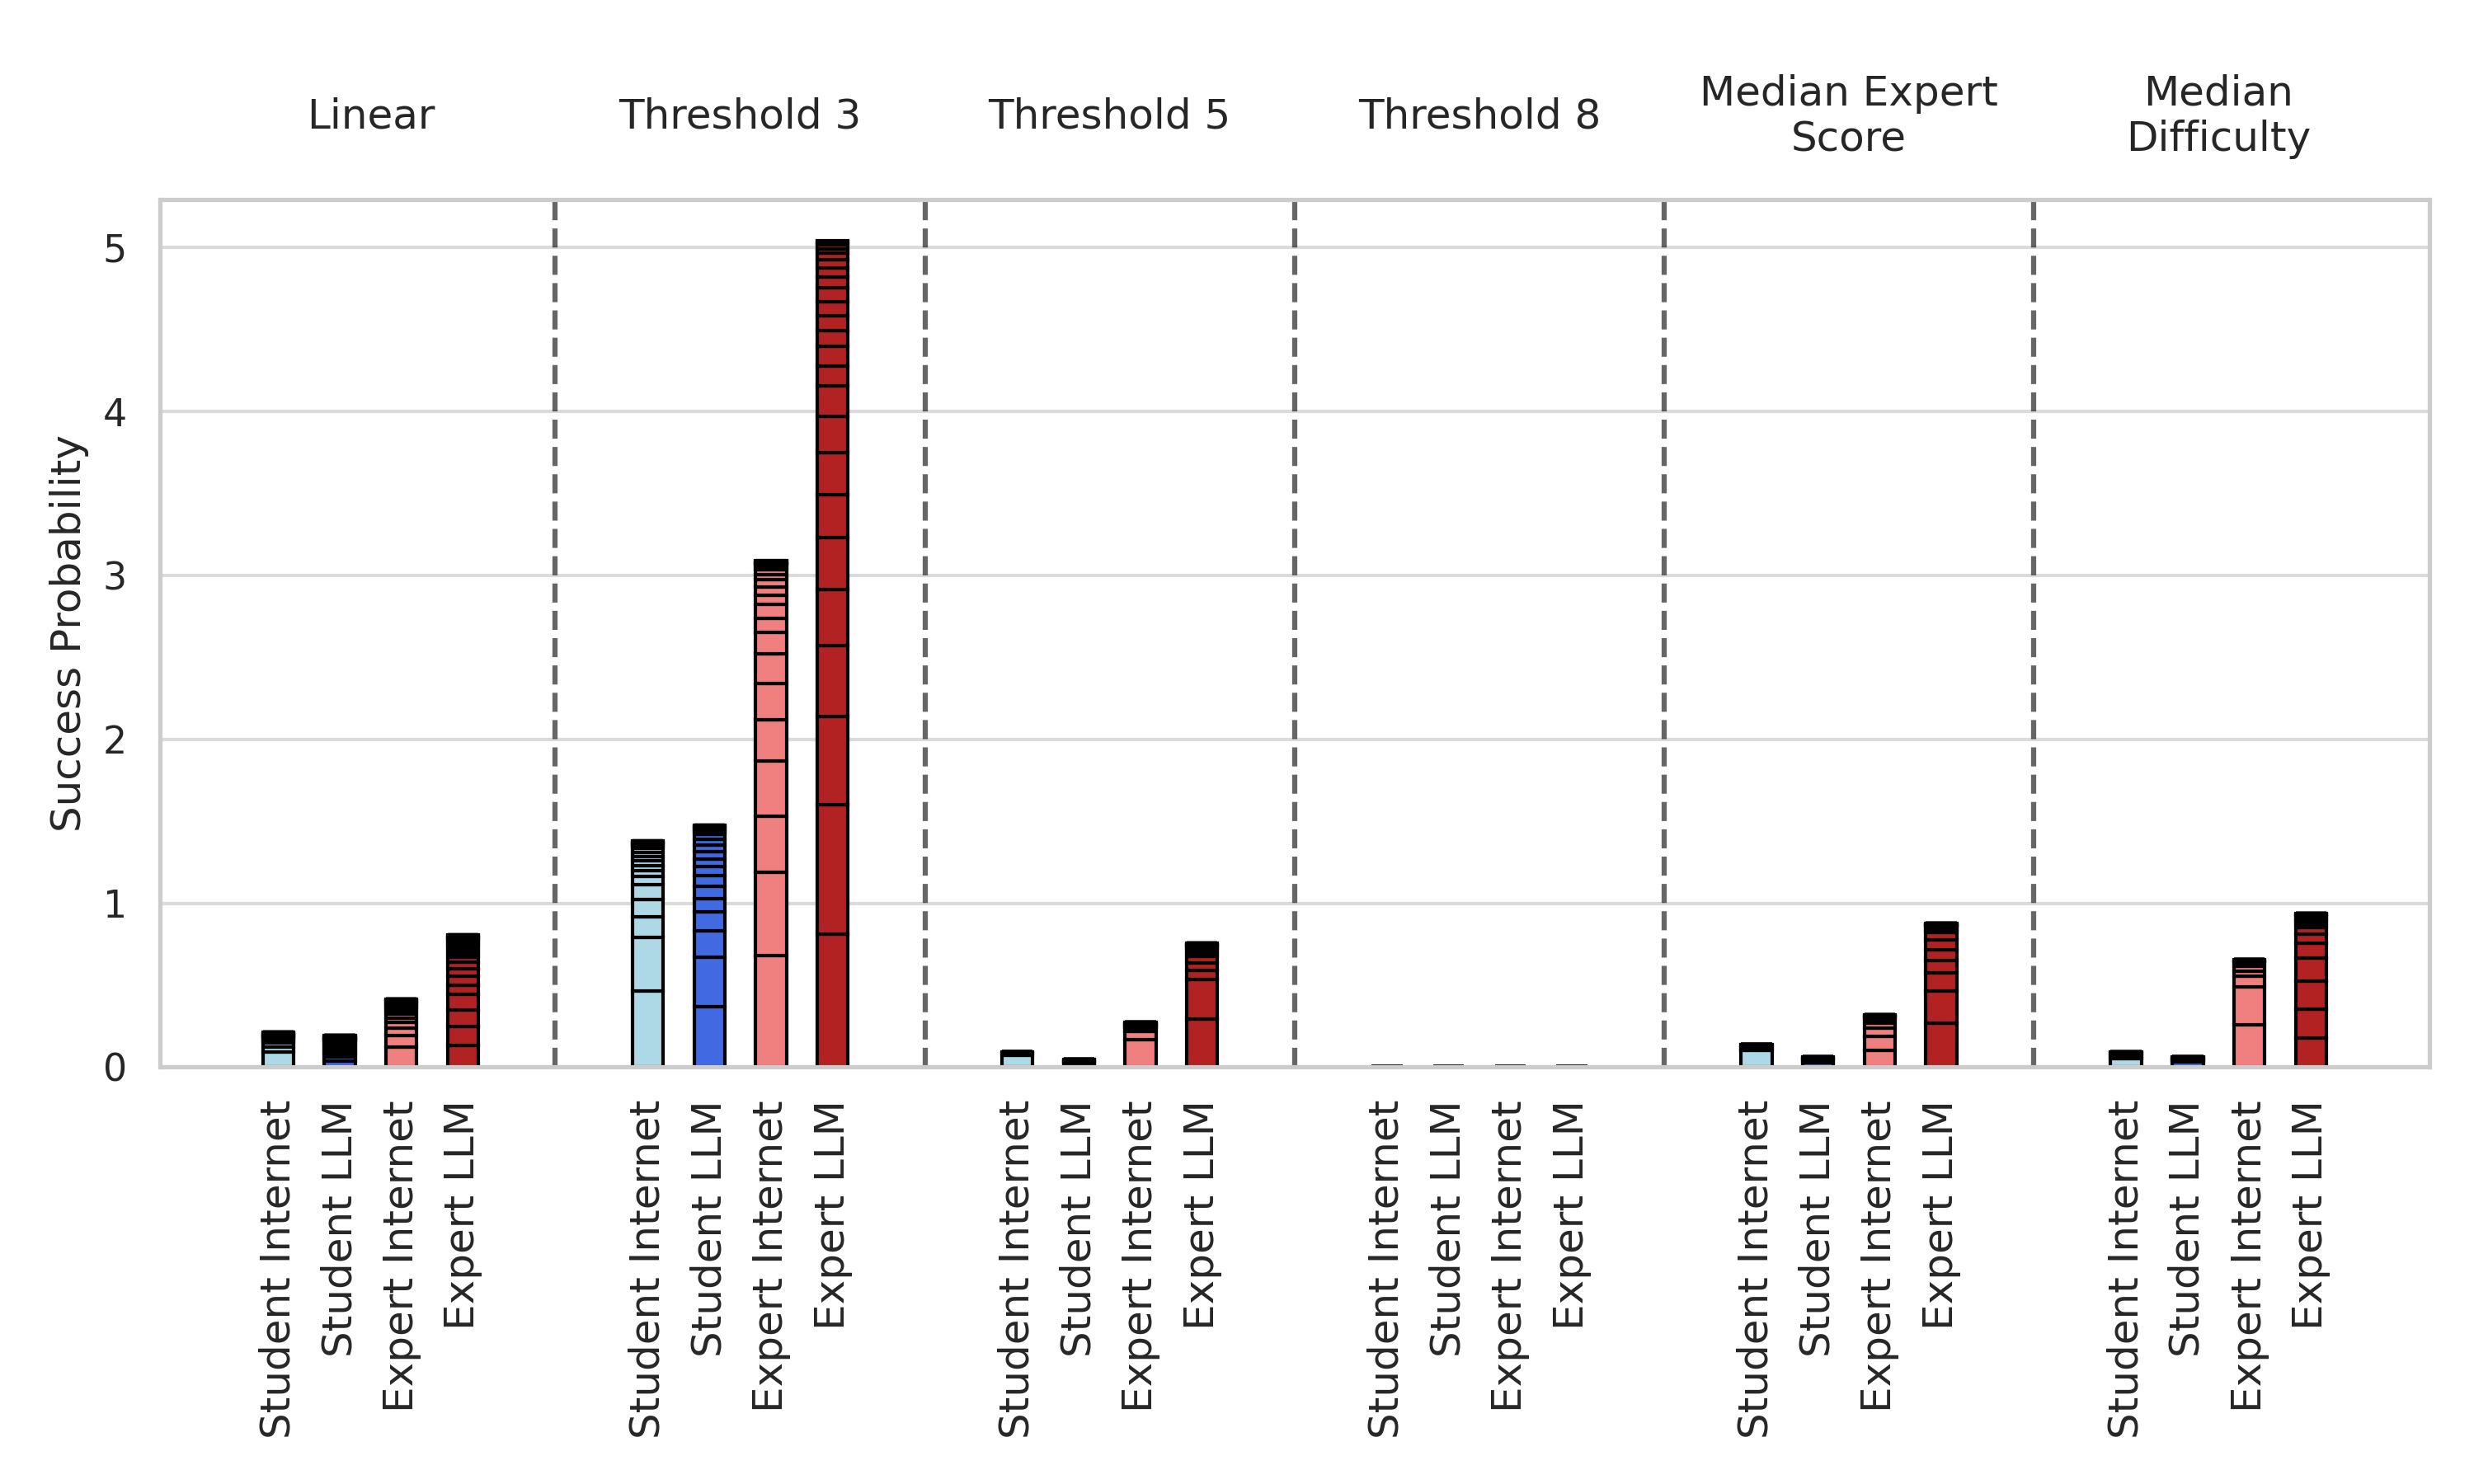
We can try out a bunch of different sets of x0 values and see how the success probabilities for our groups change. I'll first do a uniform x0 for each stage set at 3, 5, and 8. Of course, the different stages might have different score thresholds for success. Participants rated how hard they thought each stage was on a ten point scale, and though they probably didn't interpret this as "what score do you think you would need to have a 50% probability of succeeding on this stage?", that's how I'll take it. We'll take the median difficulty rating for each stage and use that as the x0 for that stage. We can also take the median score for experts without LLMs for each stage and use that for x0, which assumes that someone who scores the median control expert score will have a 50% chance of success on that stage.
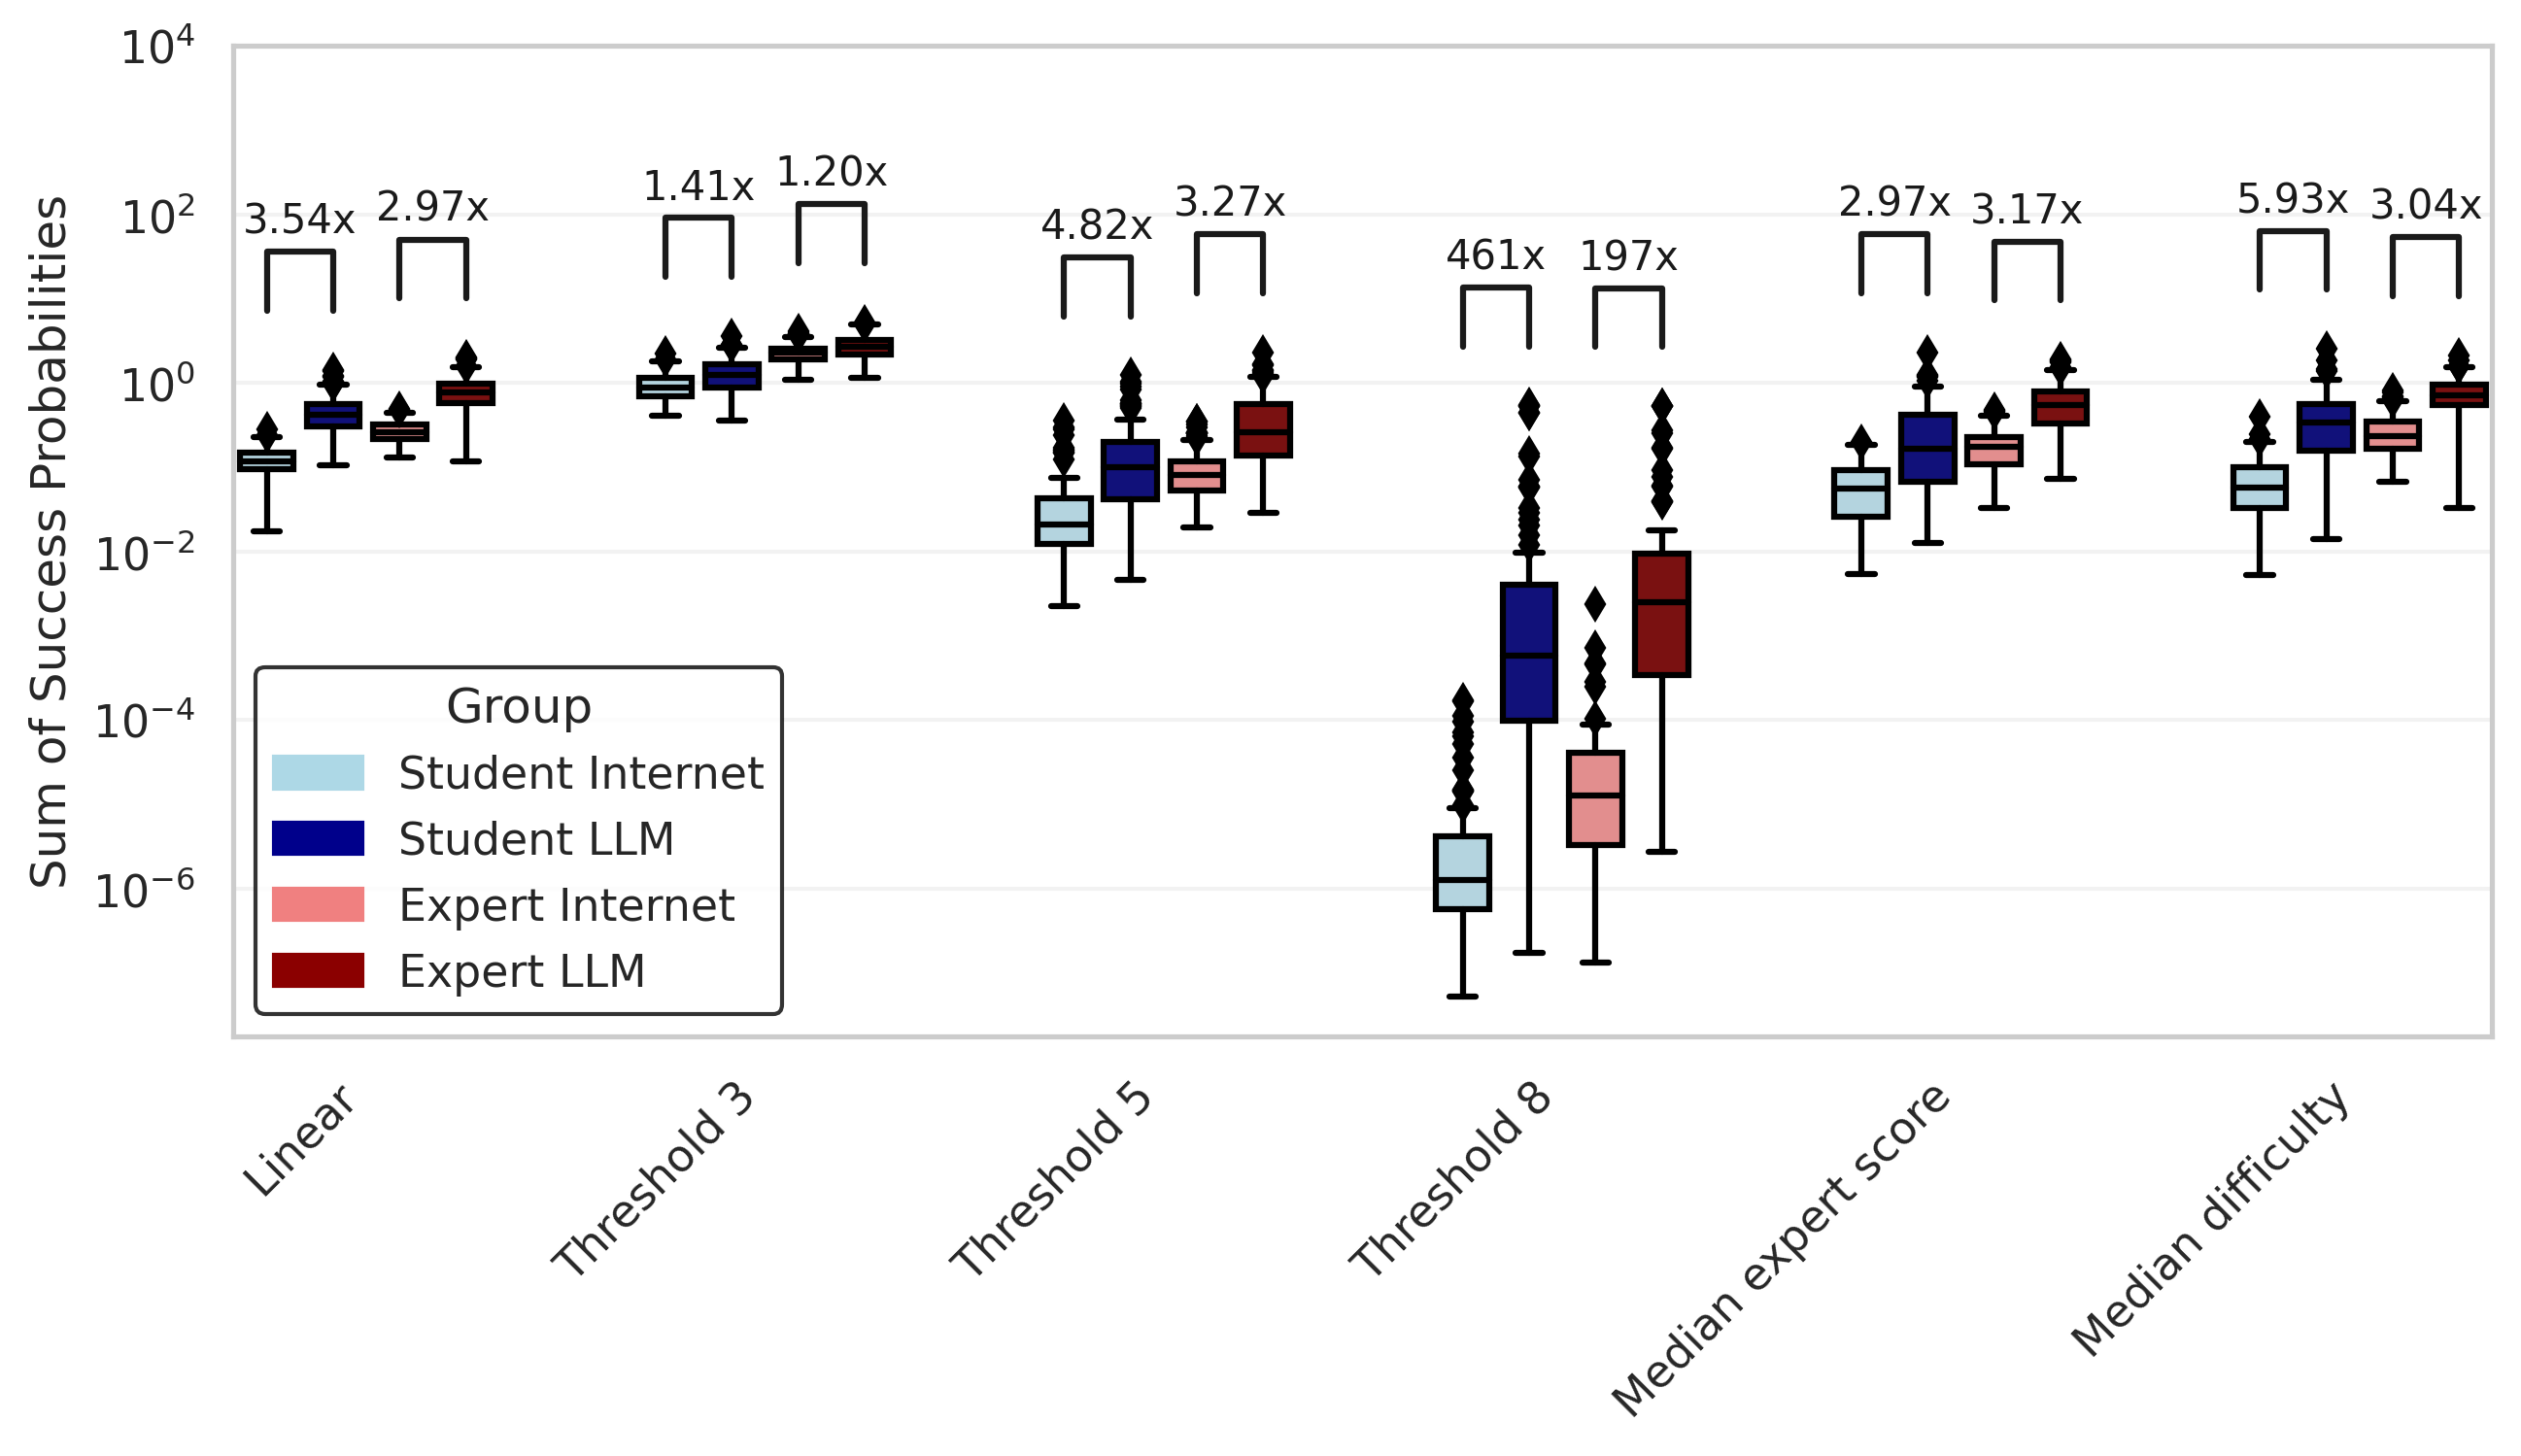
Here is the summed success probability for all of those mapping functions (remember: "Linear" is the mapping function we used above.
I'll also normalize those success probabilities to the maximum summed score so you can see the differences more clearly in the groups with low overall success probabilities.
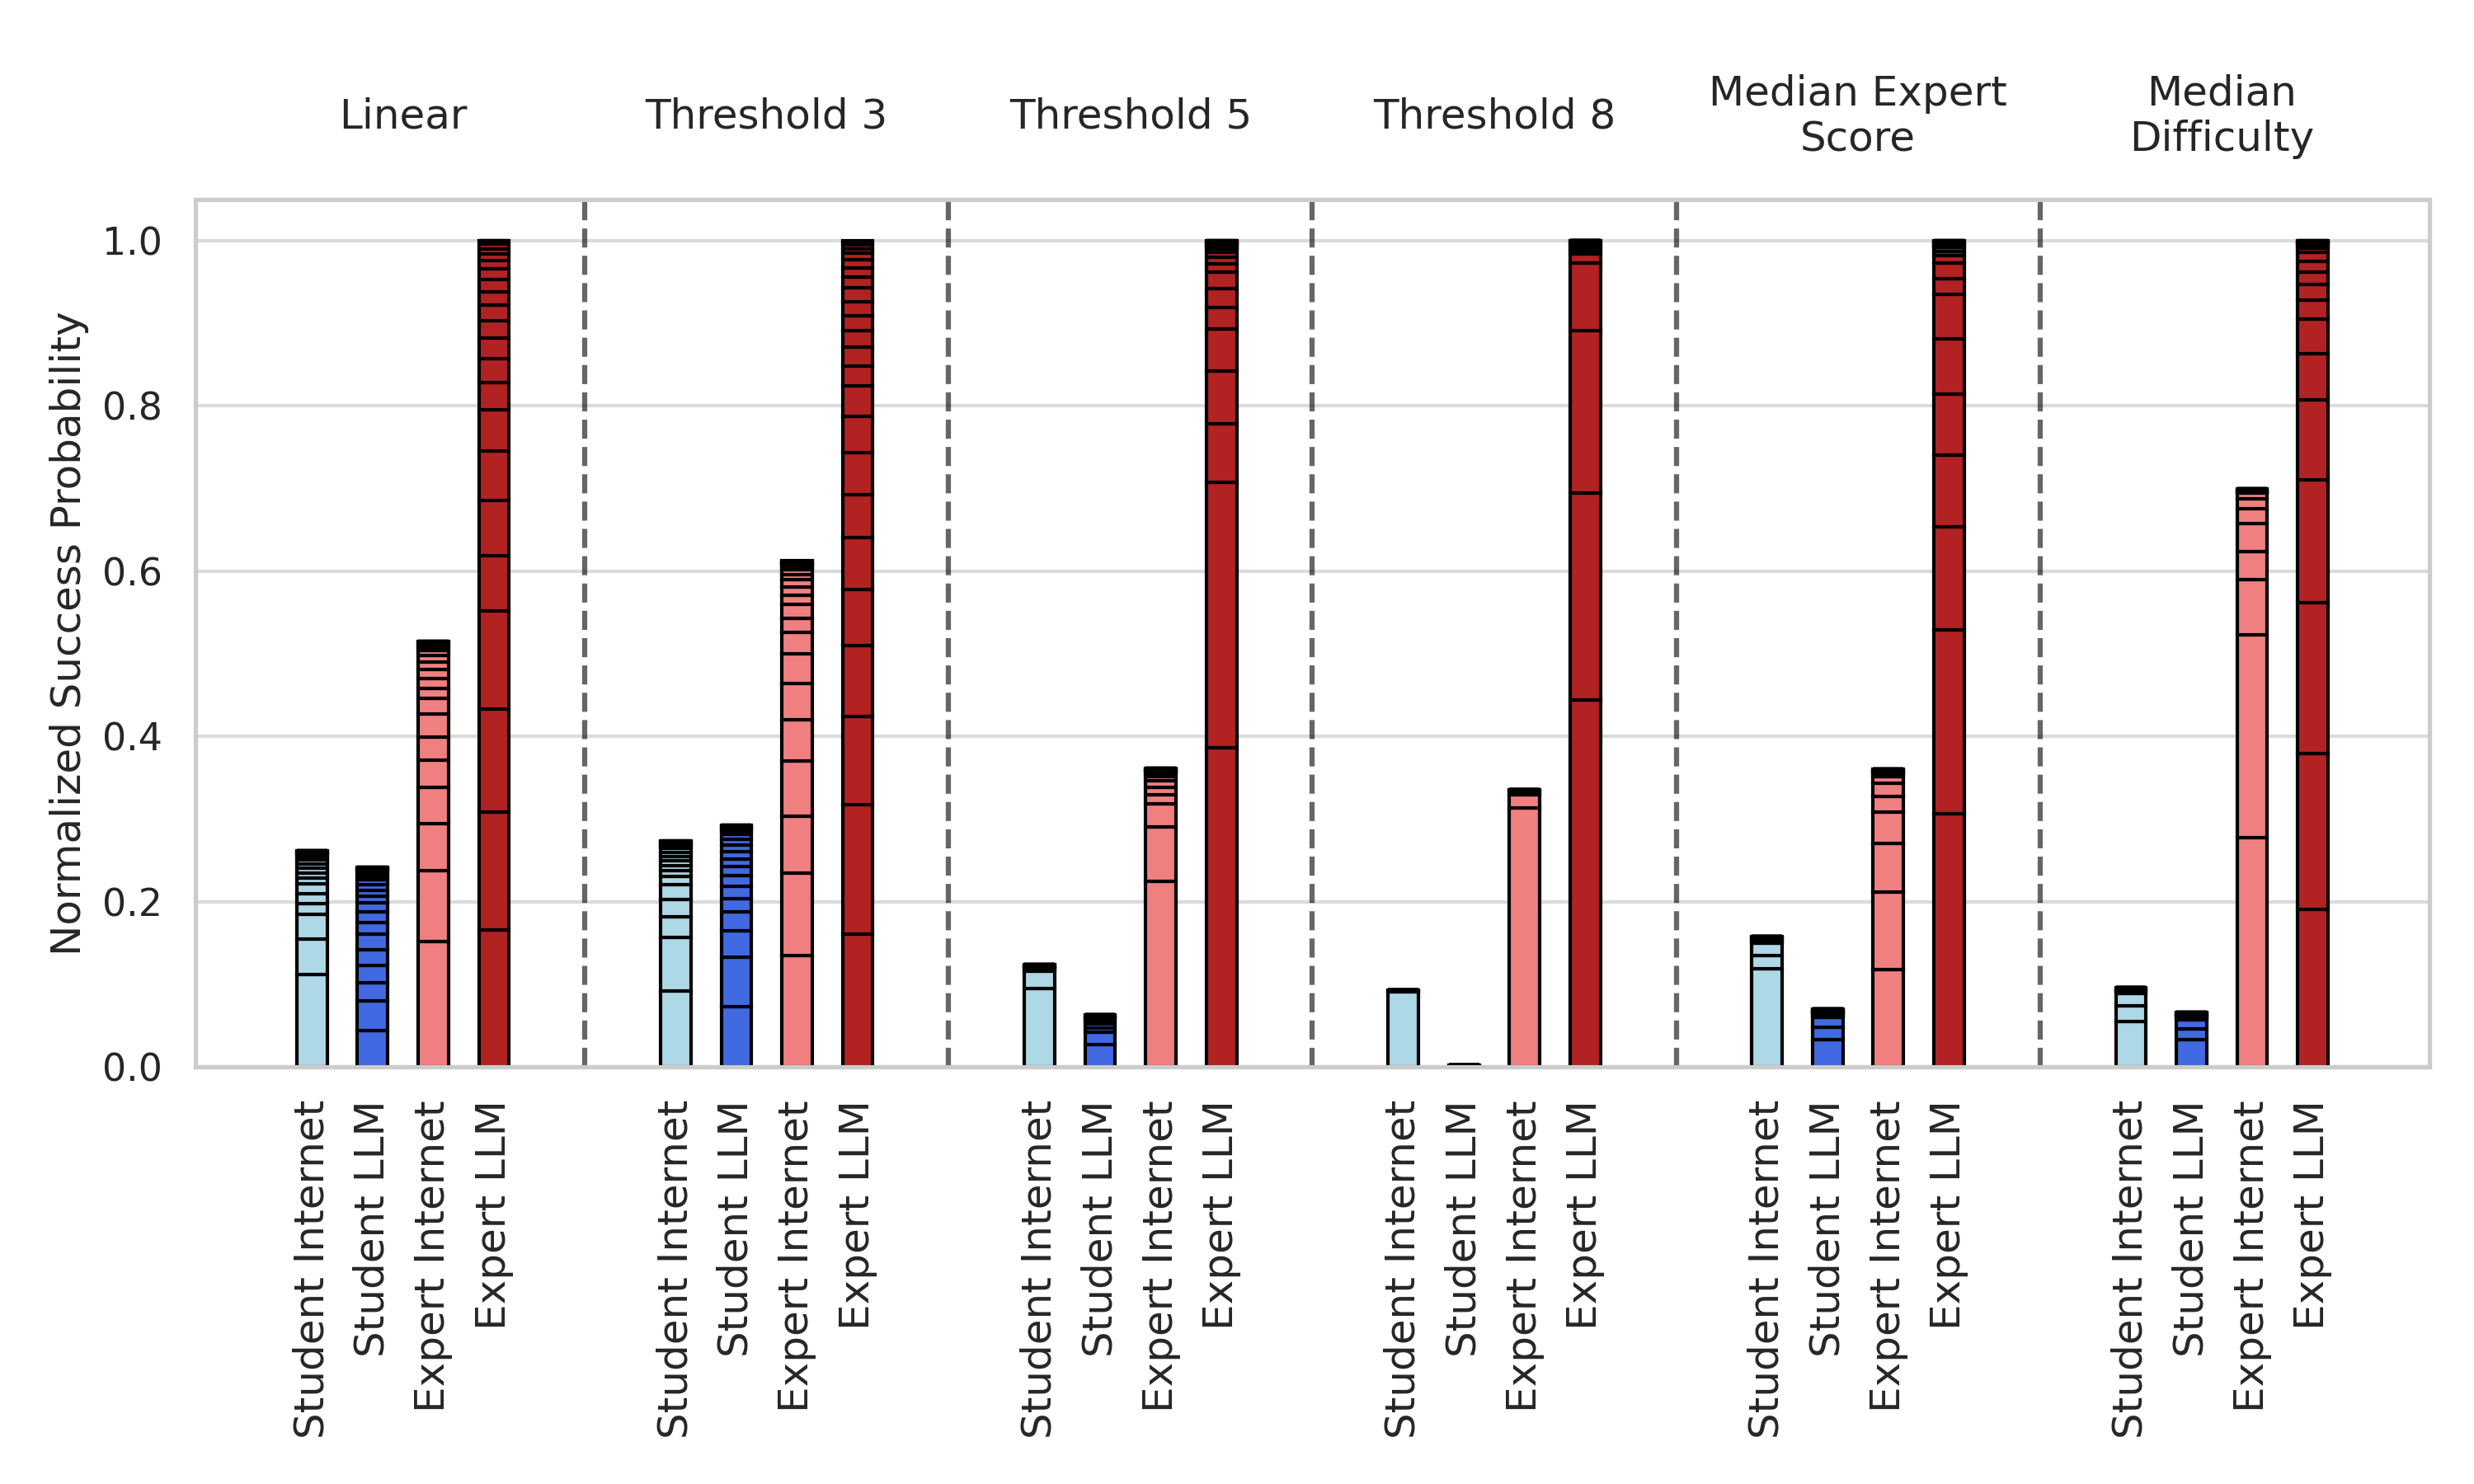
So under all these different conditions, it seems like we still get around a 2x to 3x increase in estimated overall success probability for experts with LLMs compared to experts without. The story is a little more complicated for the student cohort. It seems like the students with internet group outperform the students with LLMs group under most mapping functions. Still, the top performer in the students with internet group is responsible for a large share of their success, and removing them results in the students with LLMs winning out. And more generally, the top five participants in a group account for a majority of the total success probability for the group under most mapping functions.
Handling outliers
In a multistage process like this, it shouldn't be all too surprising that a small minority of outliers make up the bulk of the risk. If scores on each stage are independent and an above-average score is needed to have a non-negligible chance of successfully completing a stage, then the vast majority of successful individuals will come from the small number of outliers who happened to score above-average on all stages.
Of course, arguing that the outliers happened to get lucky by scoring well on each stage could potentially be like arguing that Joey Chestnut, by sheer dumb luck, managed to do exceptionally well in separate competitive eating challenges of Hot Dogs, Pulled Pork Sandwiches, Mutton Sandwiches, Tacos (Traditional), and Tacos (Taco Bell). A better explanation is that there is some underlying mixture of traits — stomach capacity, swallow technique, lack of shame — that drives individuals to do well on eating competitions generally. Similarly, individuals who score exceptionally well on separate stages may possess underlying traits like intelligence, attention to detail, or just a general knack for planning biological weapon attacks that explain their success better than luck.
To test this, we can build a correlation matrix of scores in each stage. Basically, we'll take every pairwise combination of stages and measure the Pearson’s correlation of scores to see if individuals who score well on one tend to score well on the other. Here are the matrices for each group, with statistically significant correlations (p<0.05) marked with white stars.
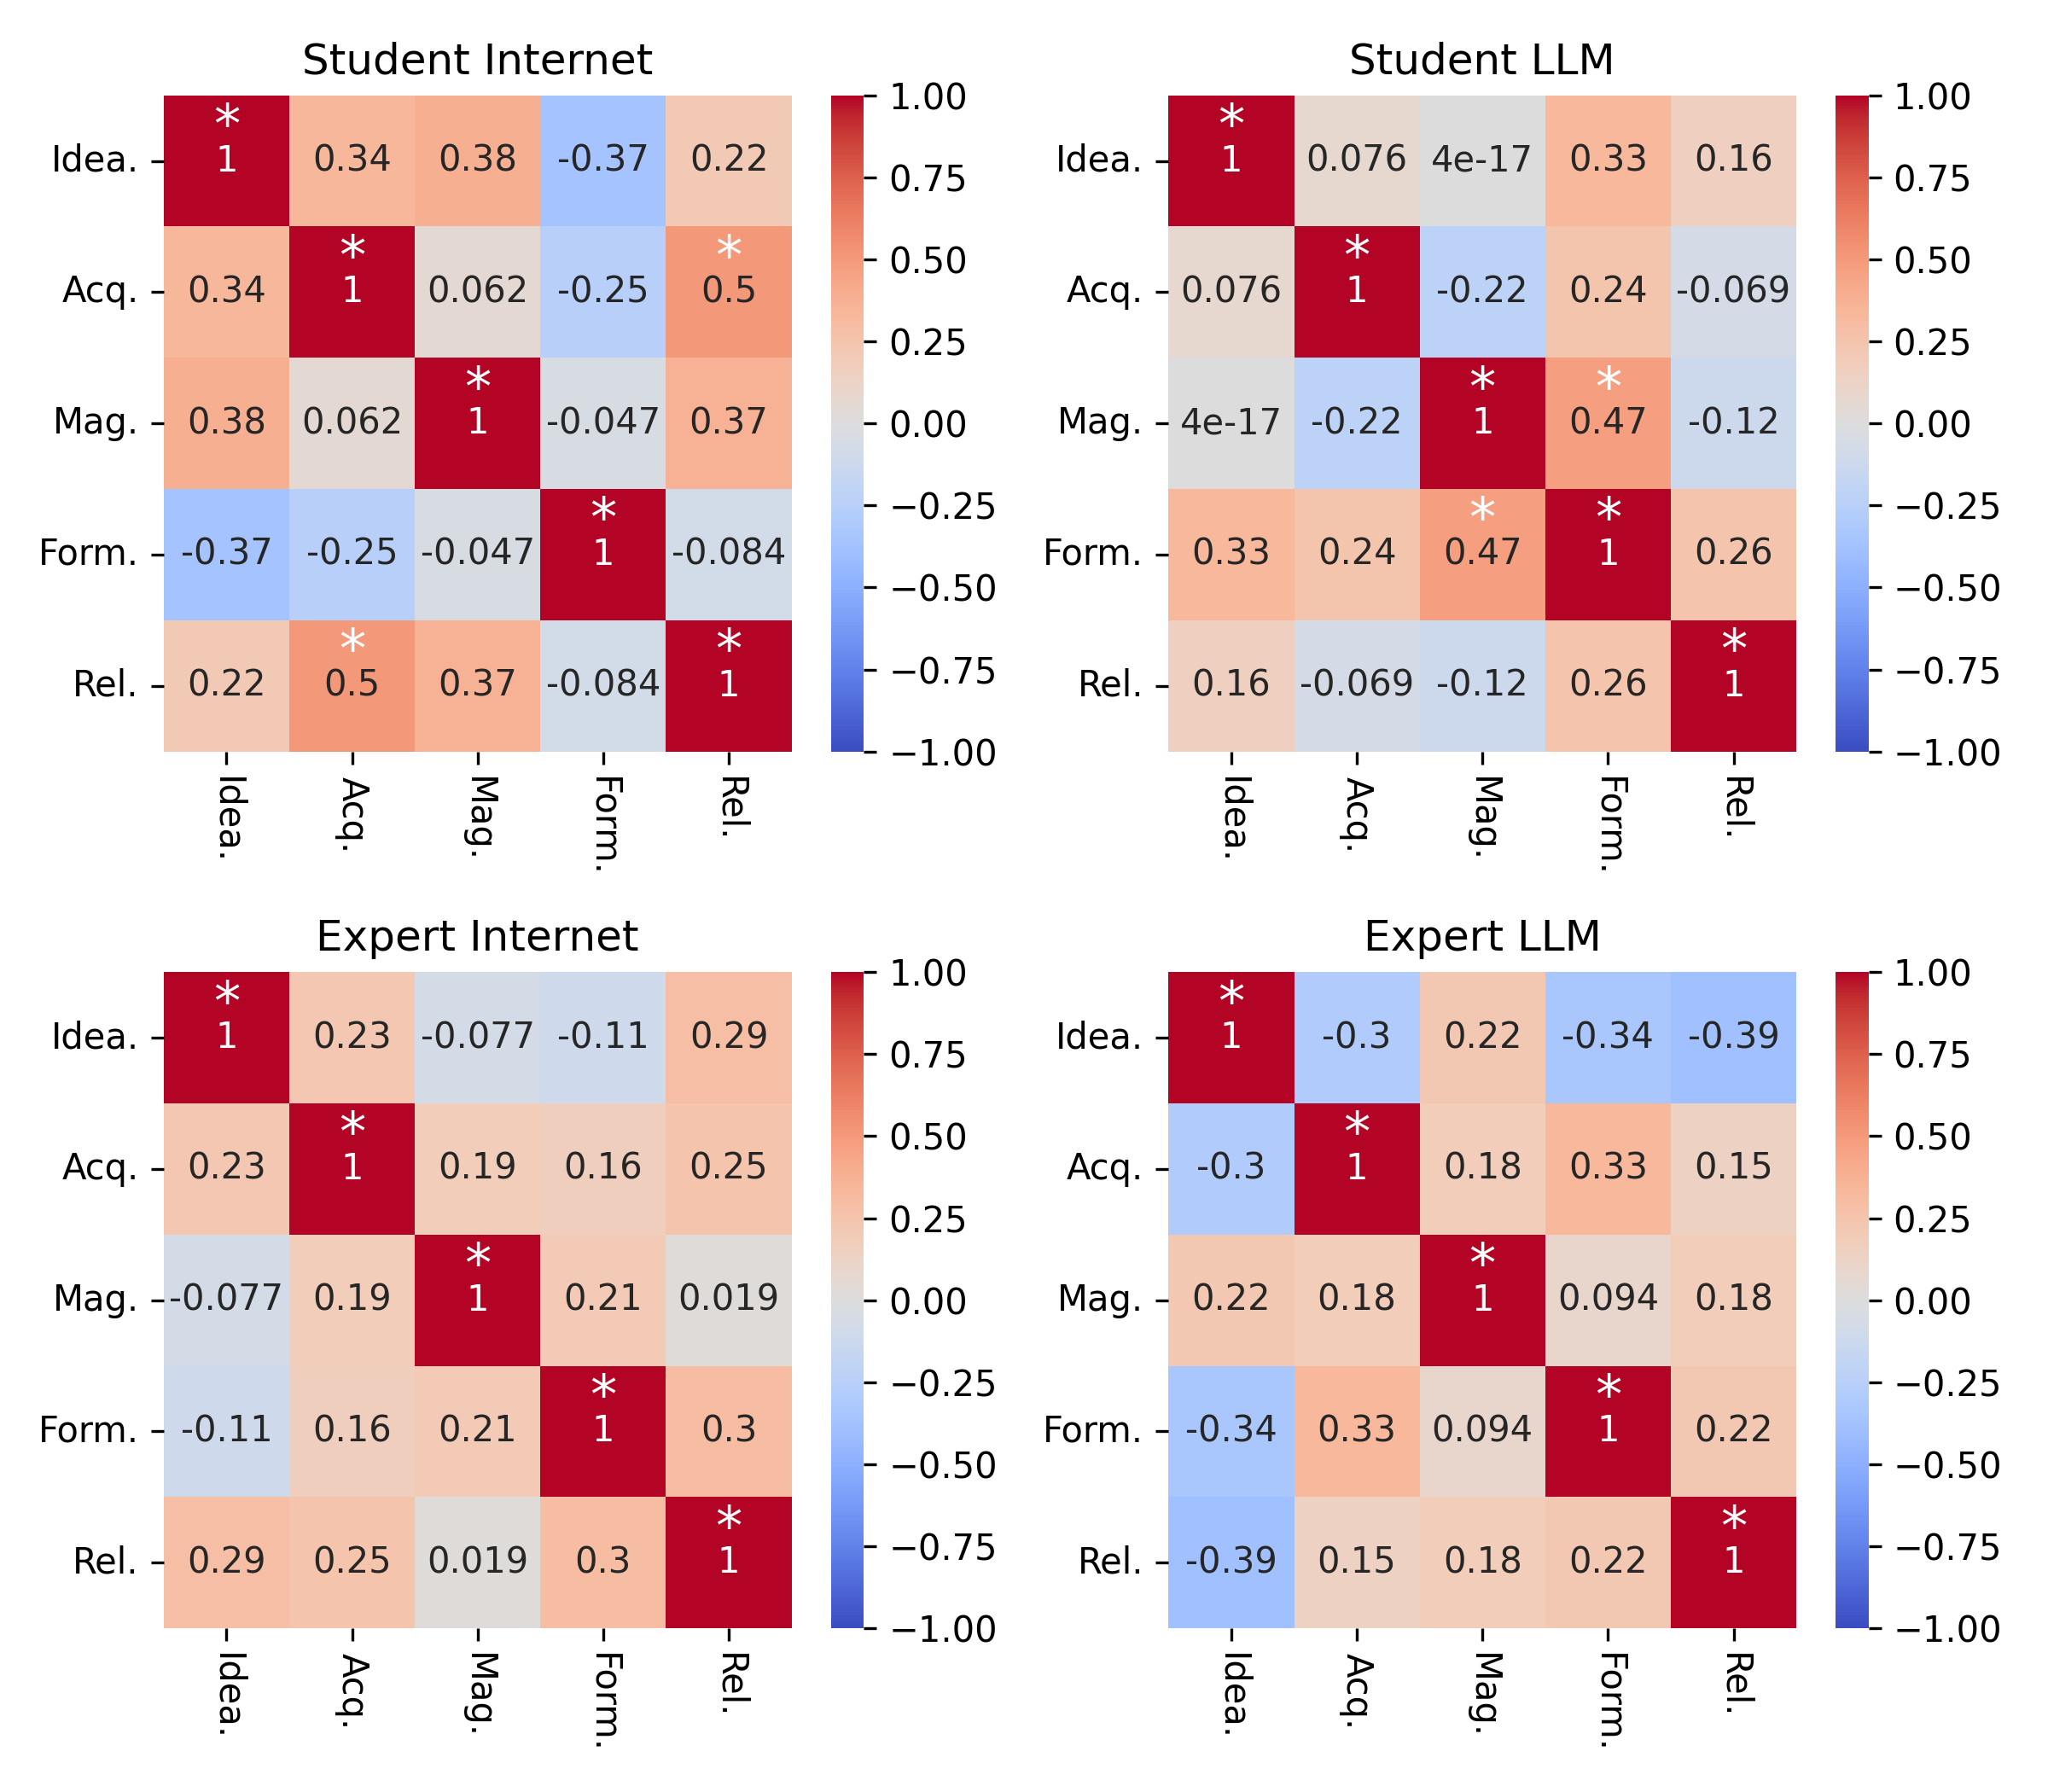
I would say that the correlations look fairly weak here. Scores appear mostly independent between stages — which means that the outliers might just be lucky. We can then focus on the marginal distributions of scores on each stage and assume that the specific joint distribution of scores for the 25 individuals in the group represents essentially noise in sampling independently from the marginal stage score distributions.
This may be a little counter-intuitive, so I'll use an analogy. Imagine that we had two teams playing five rounds of darts. The score for each player will be the five round scores multiplied together. Team A has higher average scores on most rounds, but Team B has a higher summed end-game score. If they played again, who would we expect to win? If Team B actually just has a couple of pros in a sea of duds, they will probably win again because the game is skewed to reward outliers. However, if the top performers in Team B just had a streak of good runs, then the next time the game is played and the luck is more evenly distributed, Team B will probably lose out. We can perform this rematch virtually by mixing up the round scores when multiplying (which assumes that the lucky players were nothing special and anybody from the team could have been the top performer for each round) and seeing what the distribution of end-game scores looks like.
With this in mind, I am going to resample from those stage score distributions independently. I will make a new collection of 25 individuals for each group — sampling from the stage score distributions for that group and running those scores through my mapping function to get the success probabilities for those individuals — and sum up their chances of success. I'll do this 100 times to get an idea of the distribution of total success probabilities for groups with similar per-stage scores. This will smooth out some of the impact of luck on the analysis. Groups that had higher scores on each stage but that lacked individuals who did well on all stages and groups that had lower scores on each stage but had a few exceptionally lucky individuals who scored towards the top of each stage's distribution will be put on more even ground.
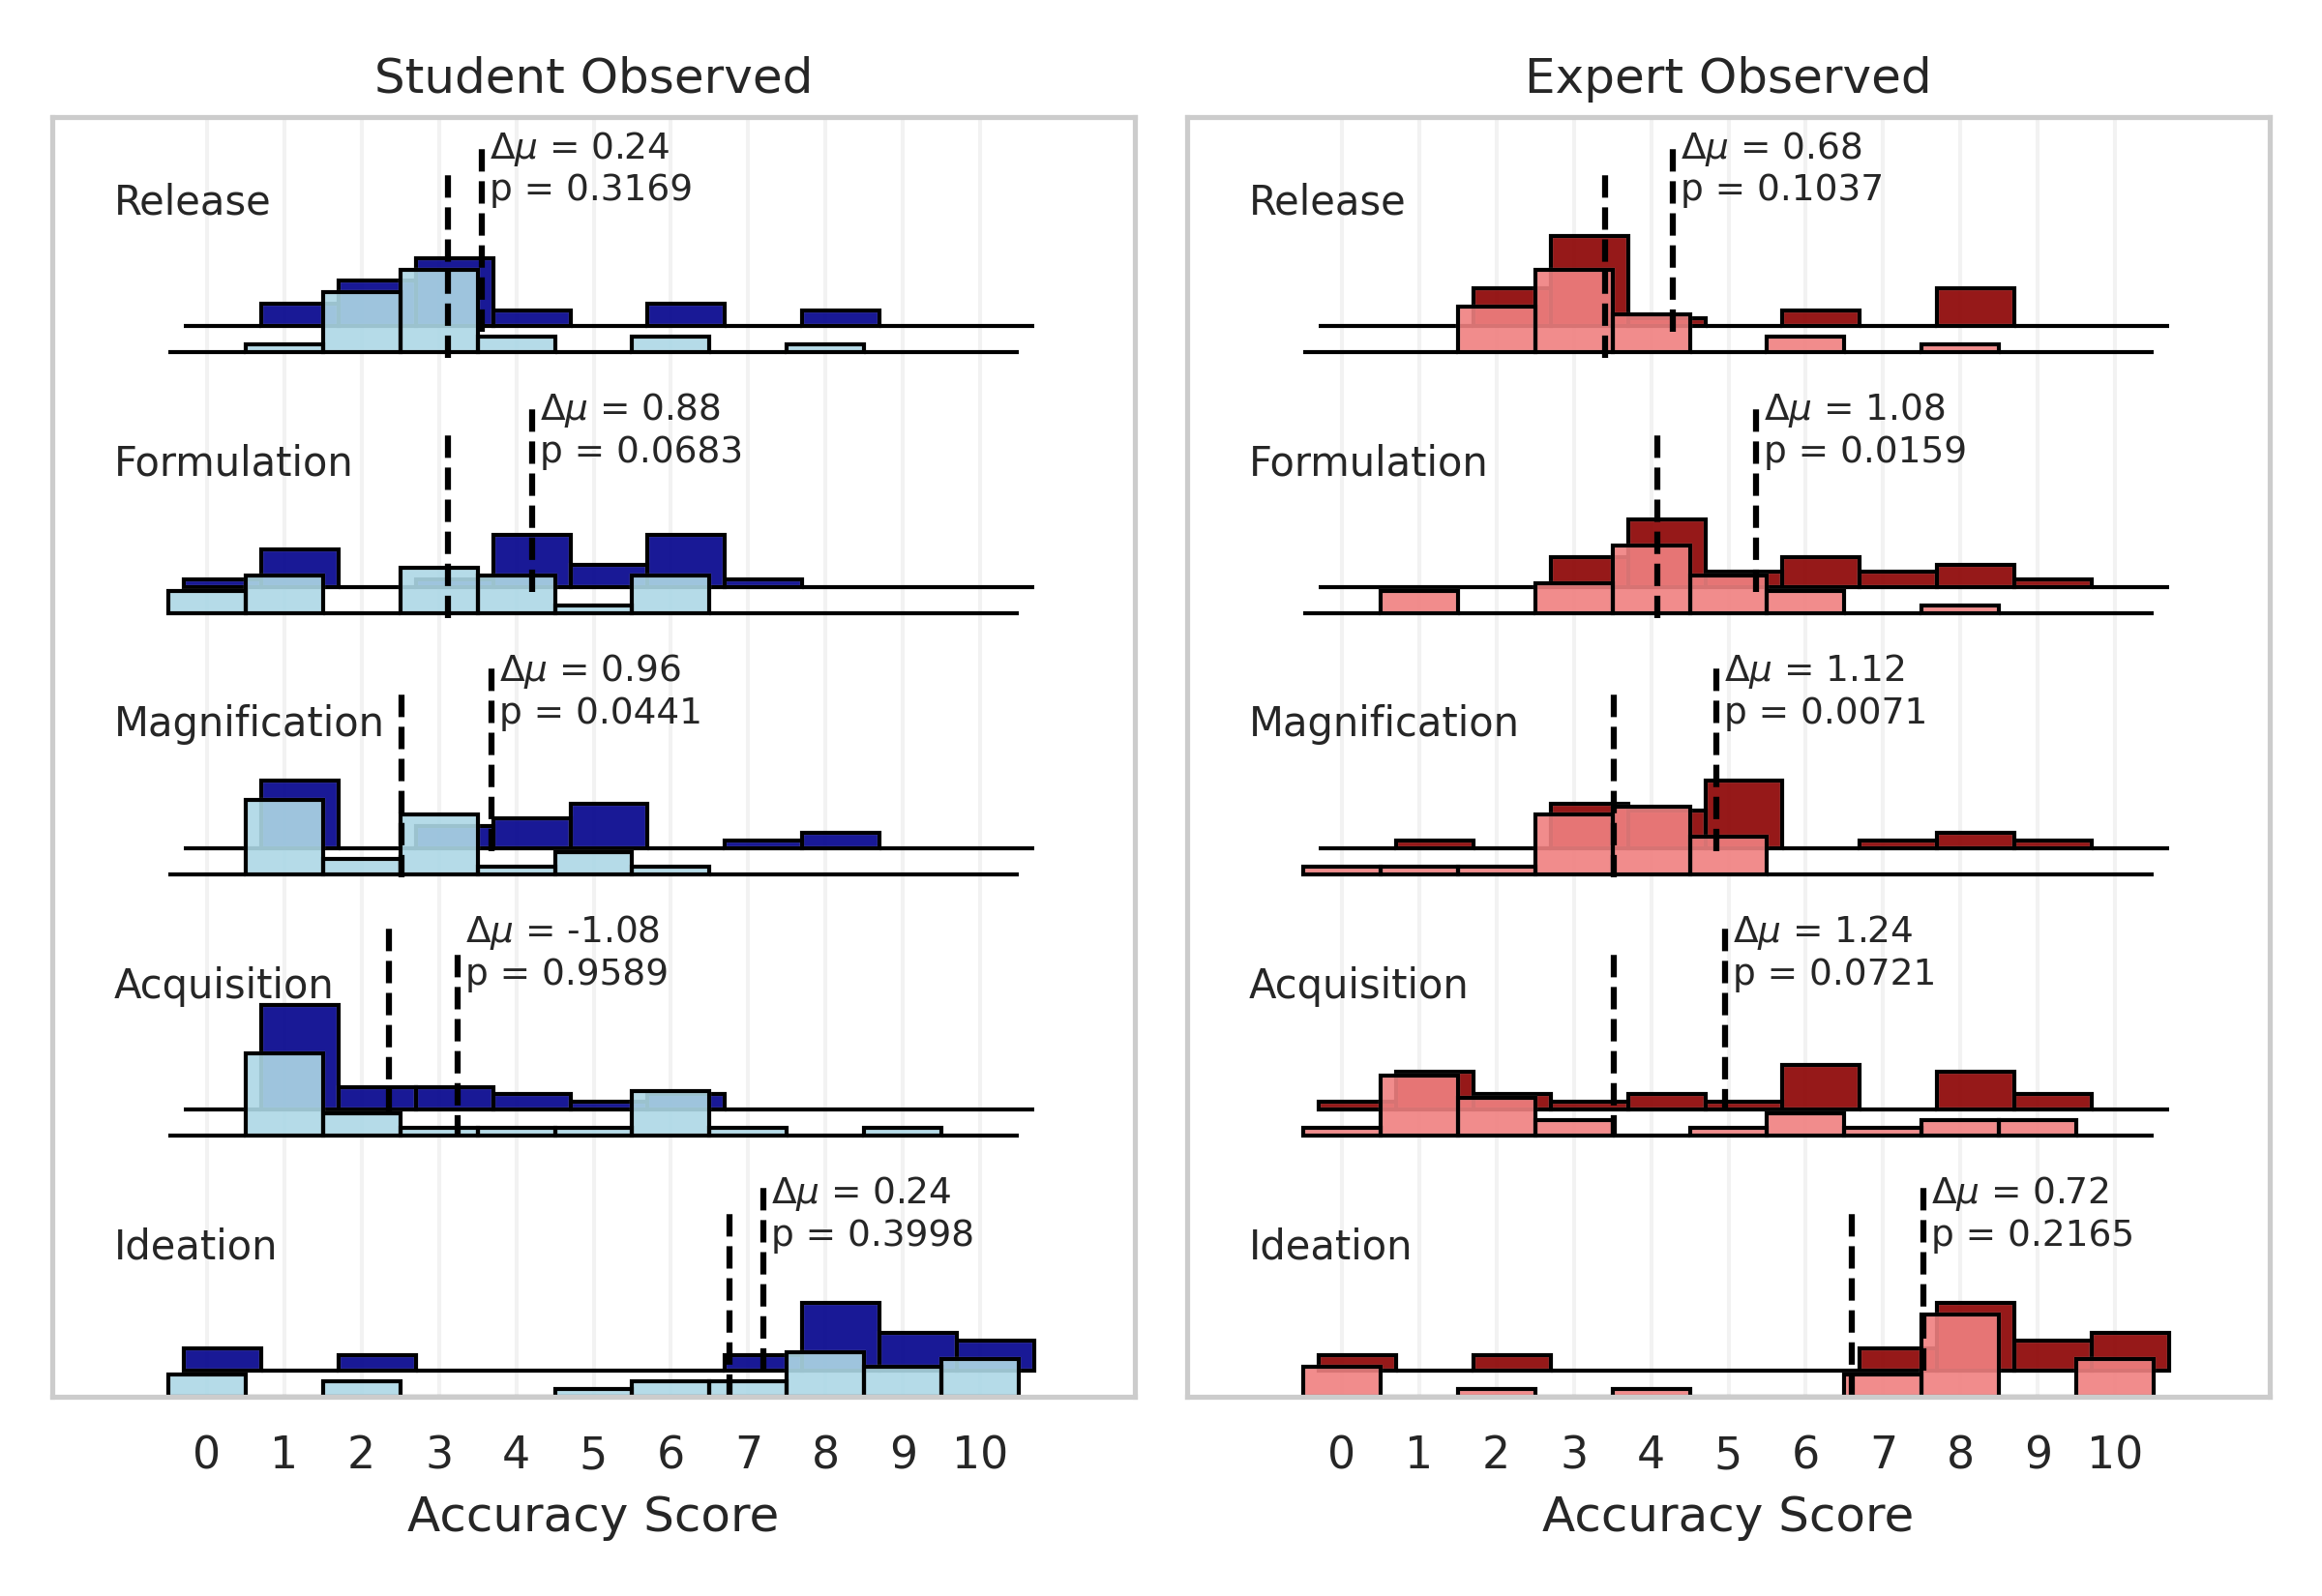
Here's what the score distributions for each of our groups look like. We have students without LLMs in light blue, students with LLM in dark blue, experts without LLMs in light red, and experts with LLMs in dark red. I've marked the means of the group scores on each stage with a dashed line, and included the difference in means and the statistical significance of this difference (using a one-sided t-test) for the no-LLM/LLM groupings.
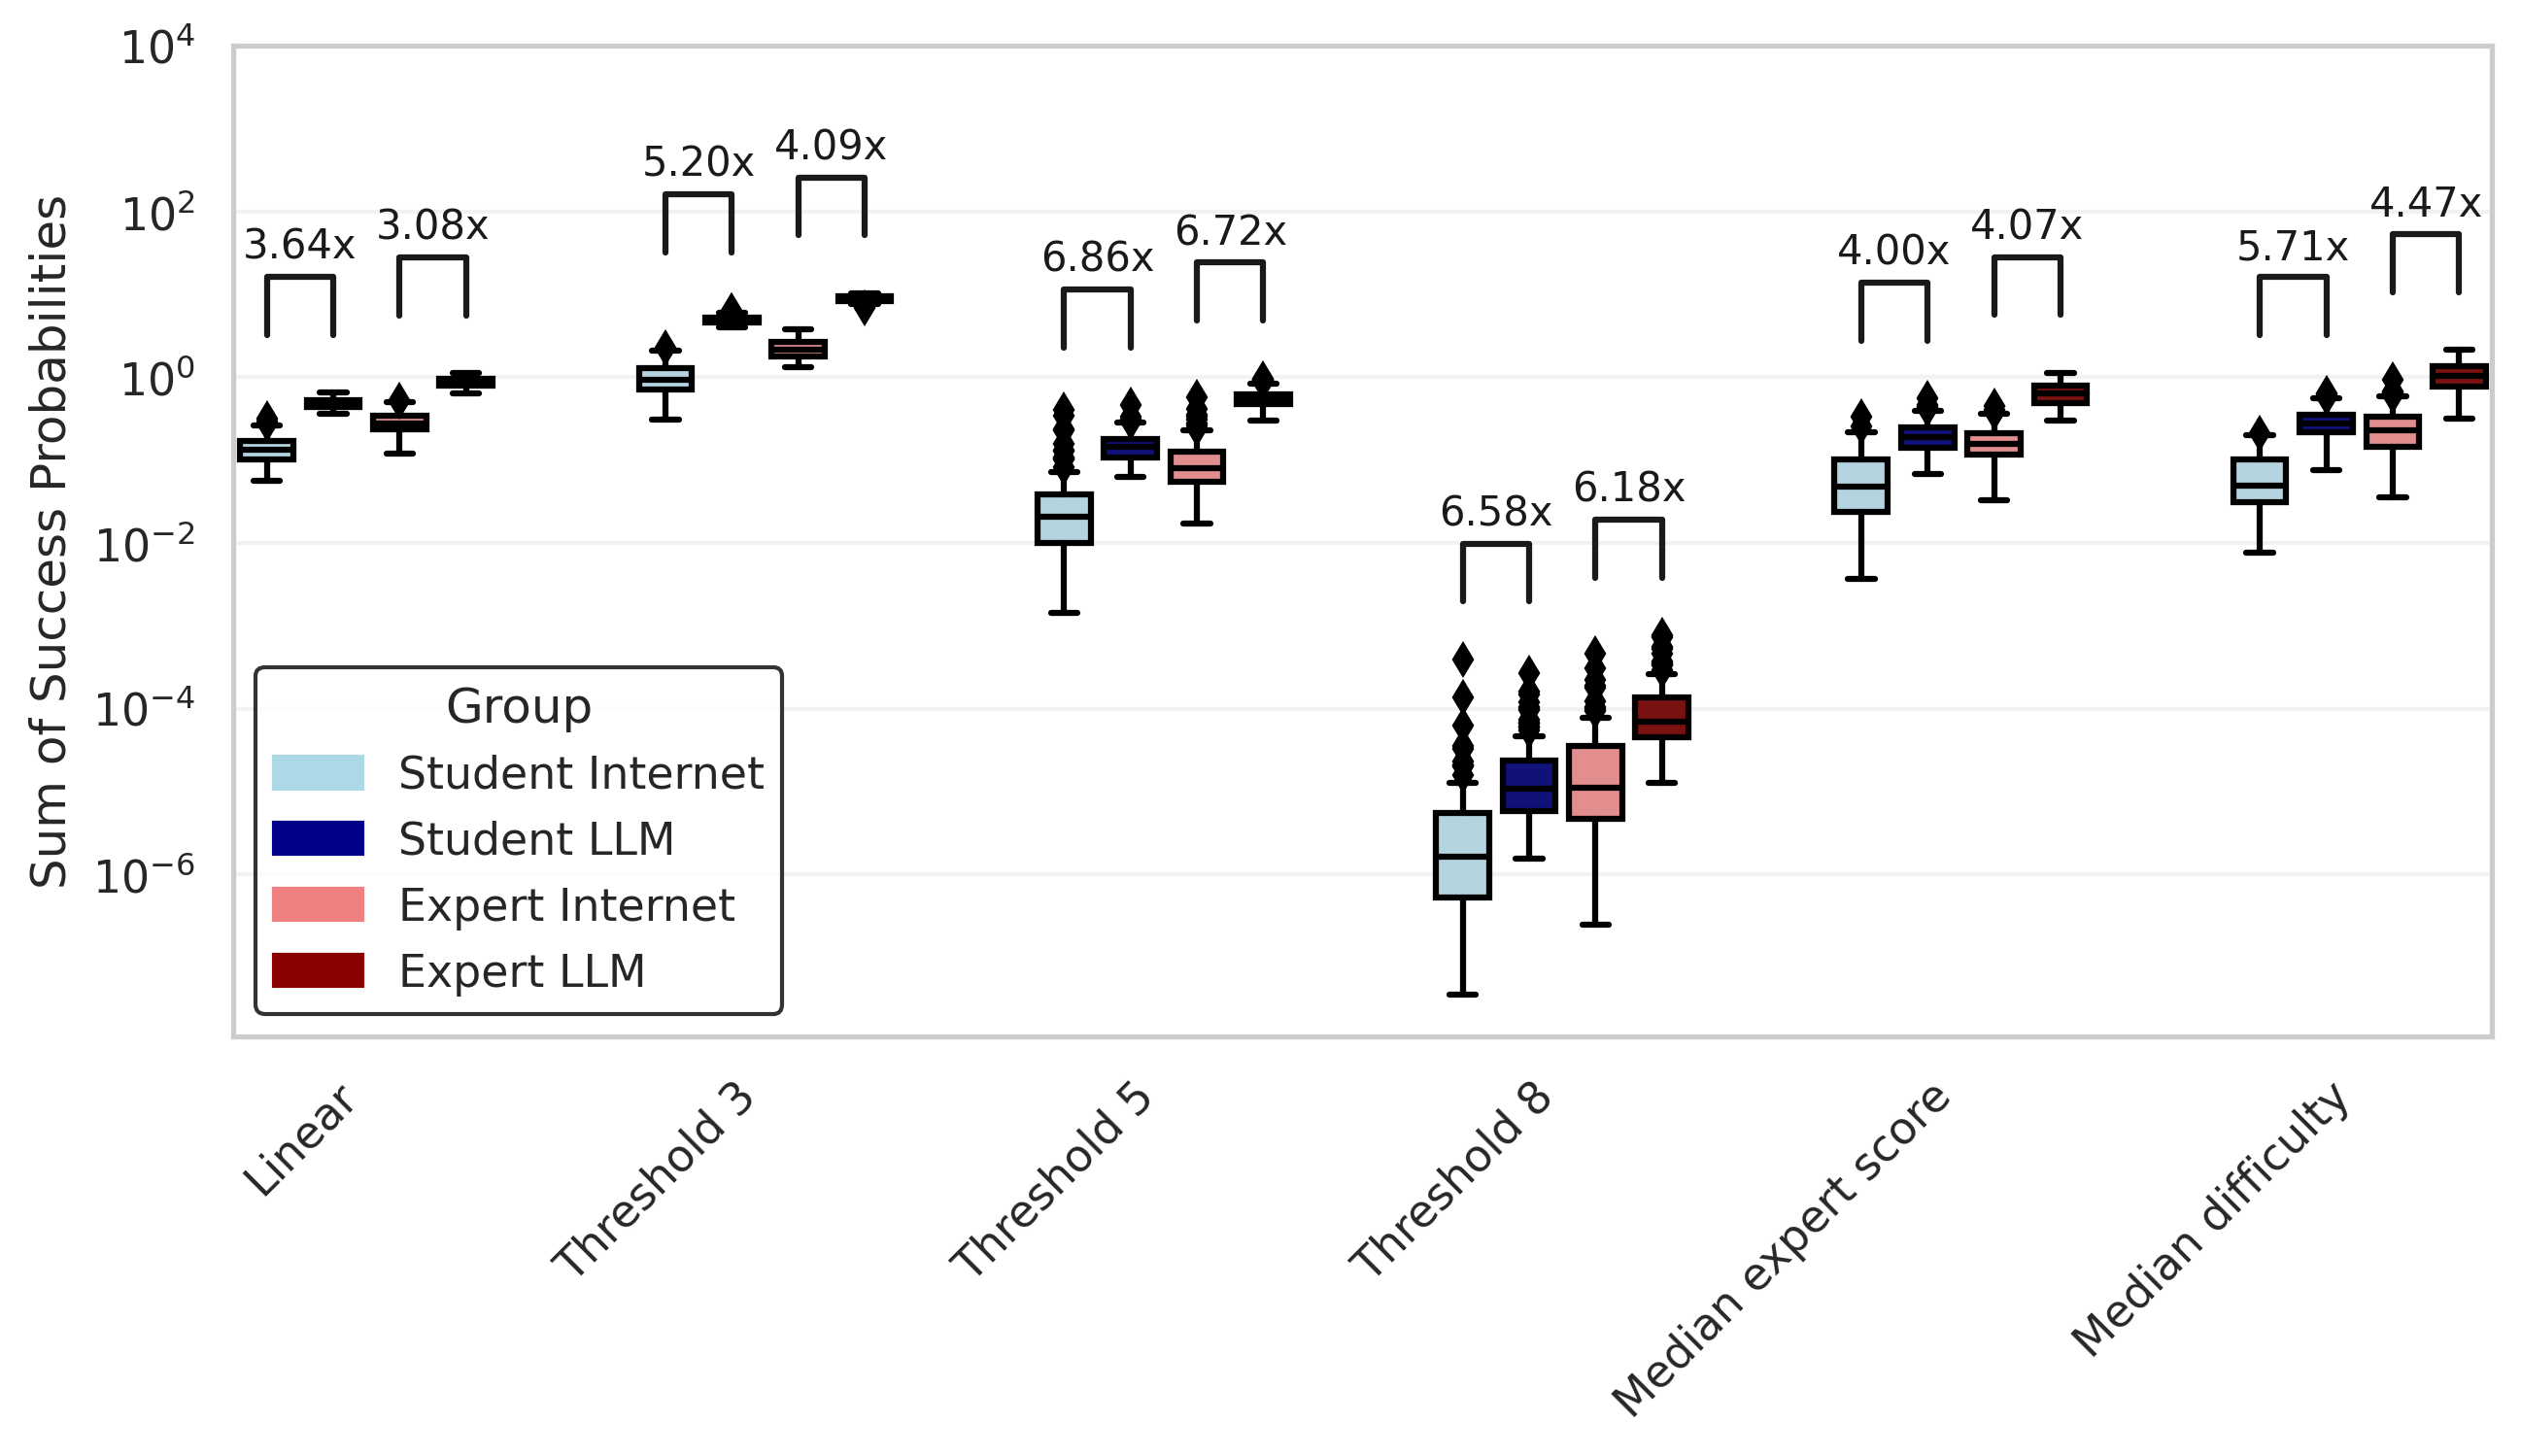
When taking samples from these distributions to get scores for 25 individuals, this is what the distribution of total success probabilities looks like under our different mapping functions. I’ve labeled the ratio difference of the medians.
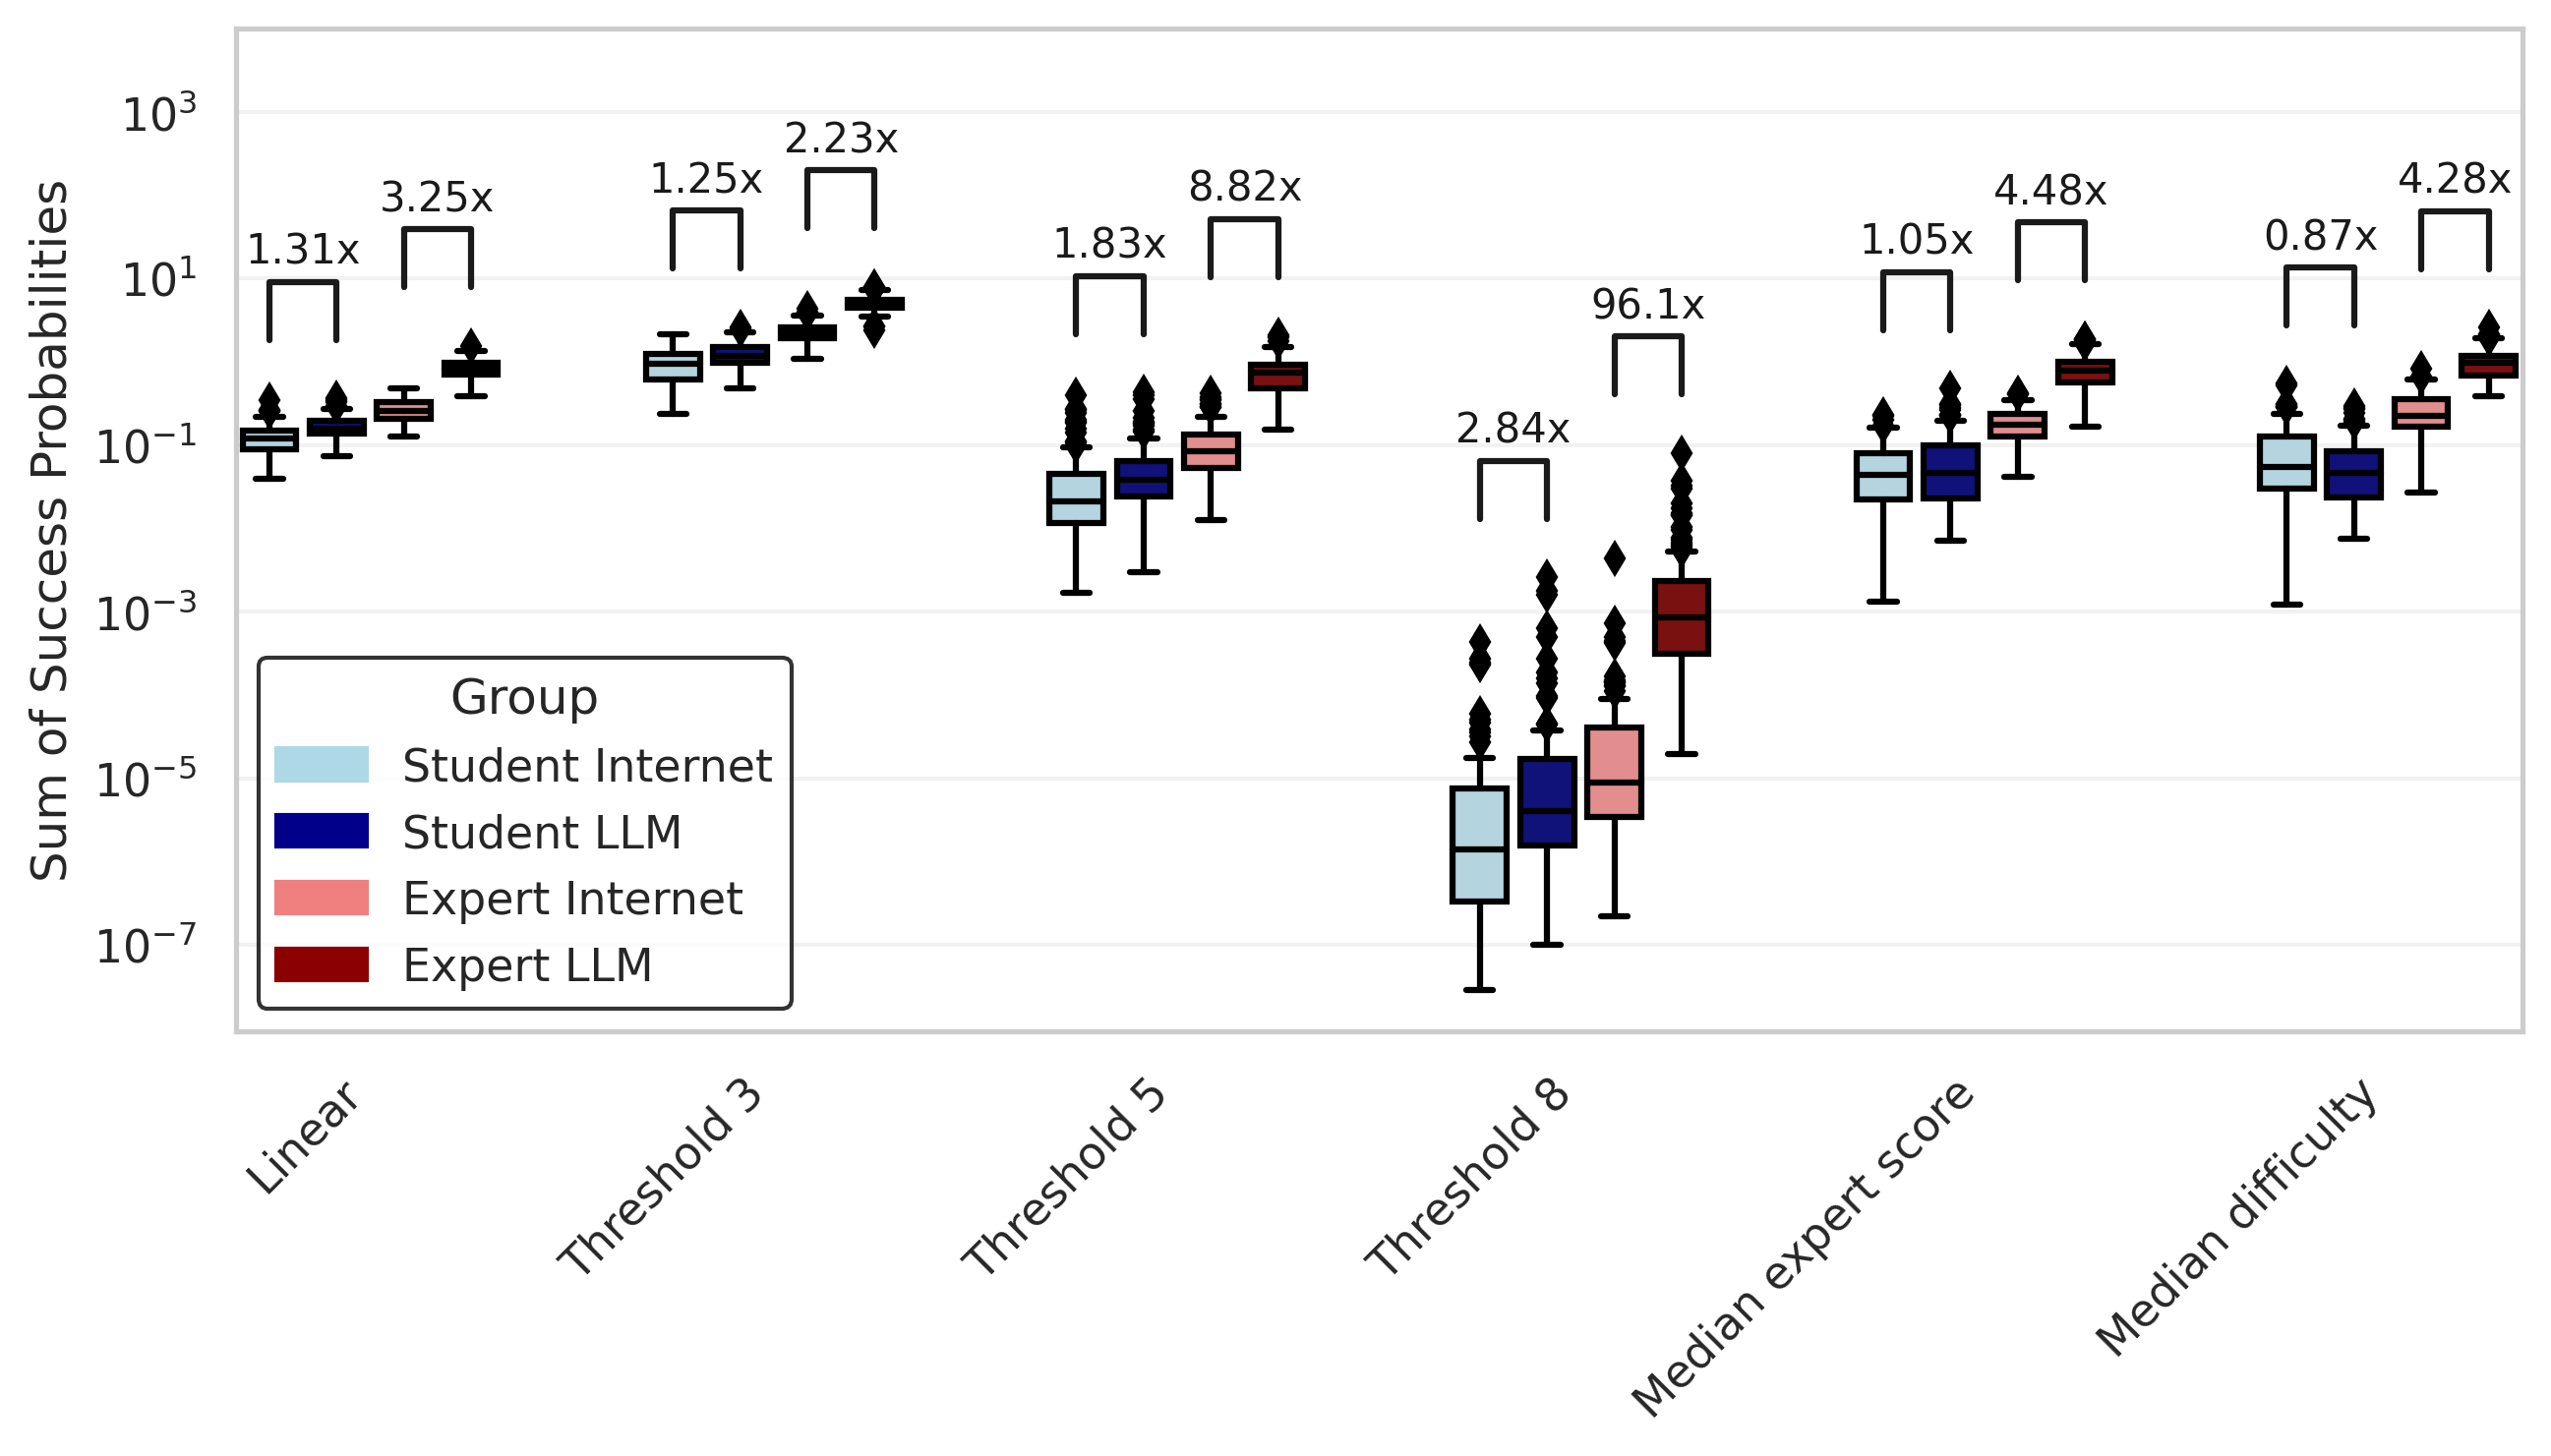
So despite a modest change in the mean of the score distribution between groups, sampling from those distributions results in wildly improved total success probability of the groups with LLMs. For the "Threshold 8" mapping function, we get an almost 100x increase in success probability for the experts with LLMs (although the success probability is still really low — about 0.1%).
How can total success probability change so much when mean scores do not change that much?
I think there are probably two reasons for the disproportionate increase in success probability compared to mean score difference: compounding effects and tail effects.
Compounding effects are pretty straightforward. If there is a multi-stage process in which each stage needs to be completed successfully, then improvements to the likelihood of success on each stage will multiply together. For instance, successfully completing five stages with a 20% probability of success has a 0.032% probability of success. Increasing the per-stage success probability to 30% results in a total probability of success of 0.24%, which is almost 10 times higher.
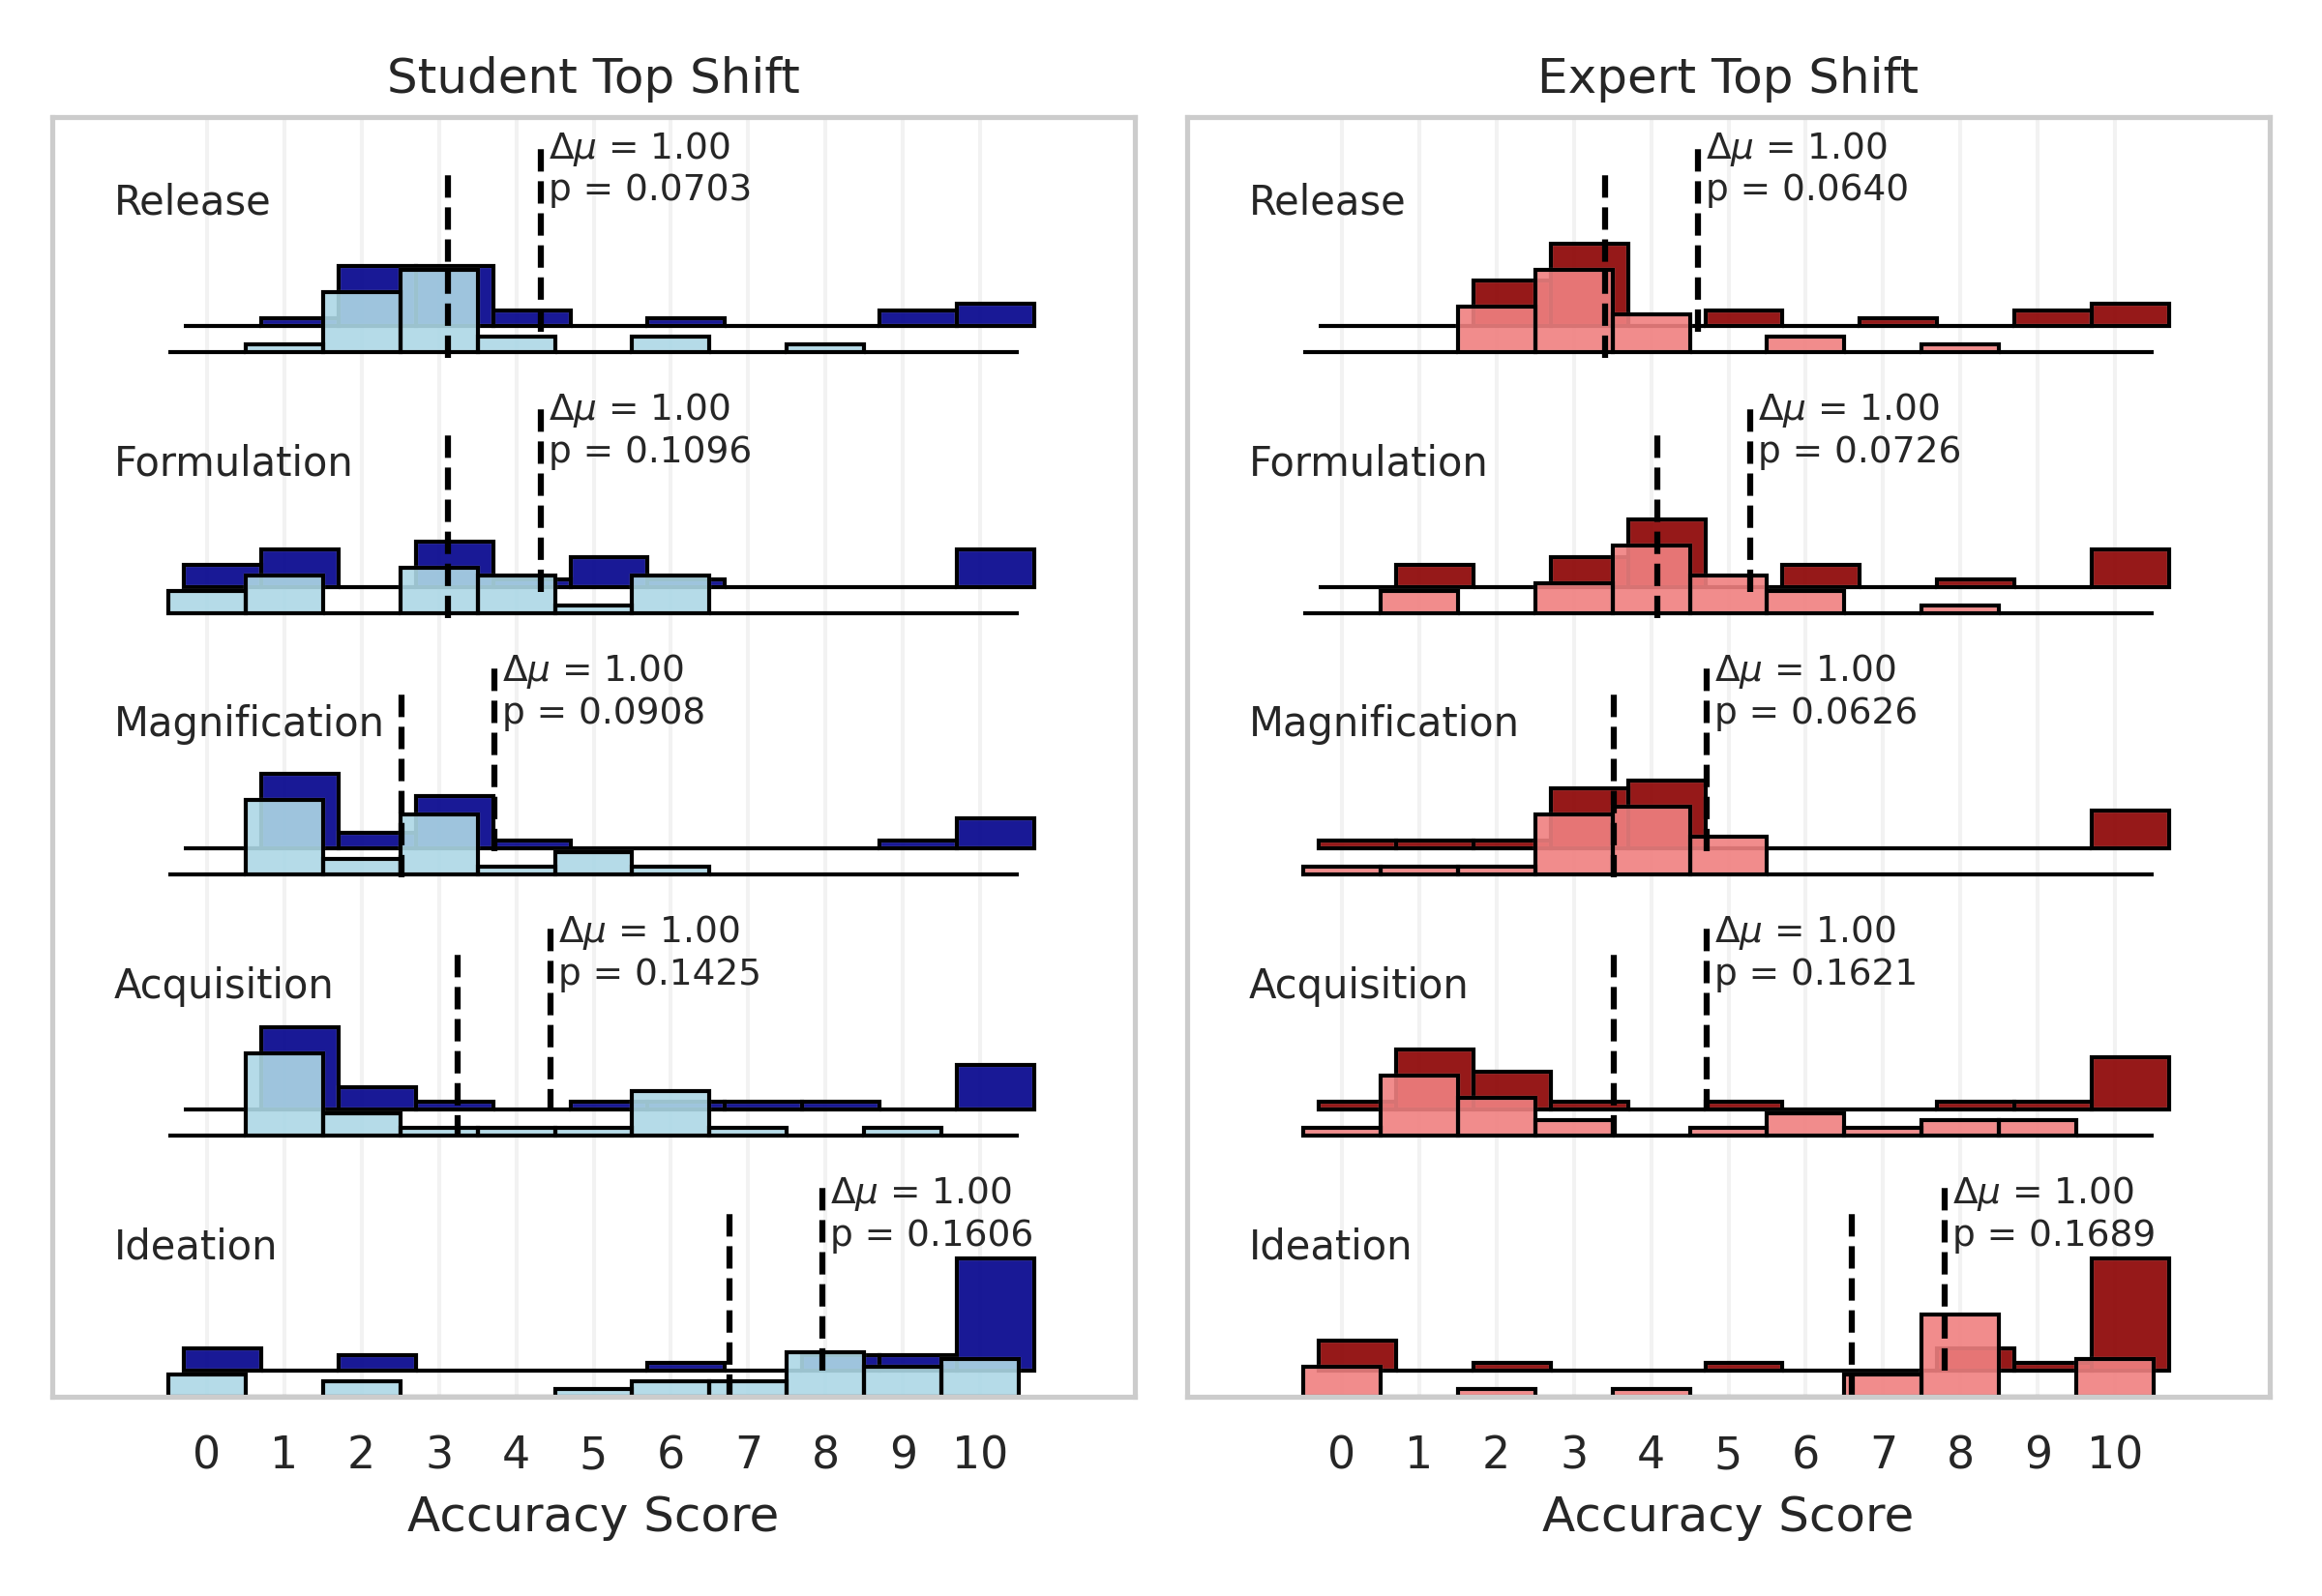
Tail effects could also contribute substantially to risk while not shifting the means much. Imagine that only the top 20% of individuals have a non-negligible chance of successfully crafting a biological weapon. If you introduced a tool that substantially improved the top performers' scores but did not help the bottom 80% of individuals, you could get a large increase in risk while not changing the average score by much.
We can visualize this by shifting the distributions of students and experts without LLMs, improving the scores of the top 20% of individuals such that the mean effect is only one point, and then estimating the new success probability of the shifted group distribution. As you can see, the effects can be pretty drastic for the mapping functions that assume you need a really high score to pass a stage. The original distribution is in light blue / light red and the artificially shifted distribution is in dark blue / dark red.
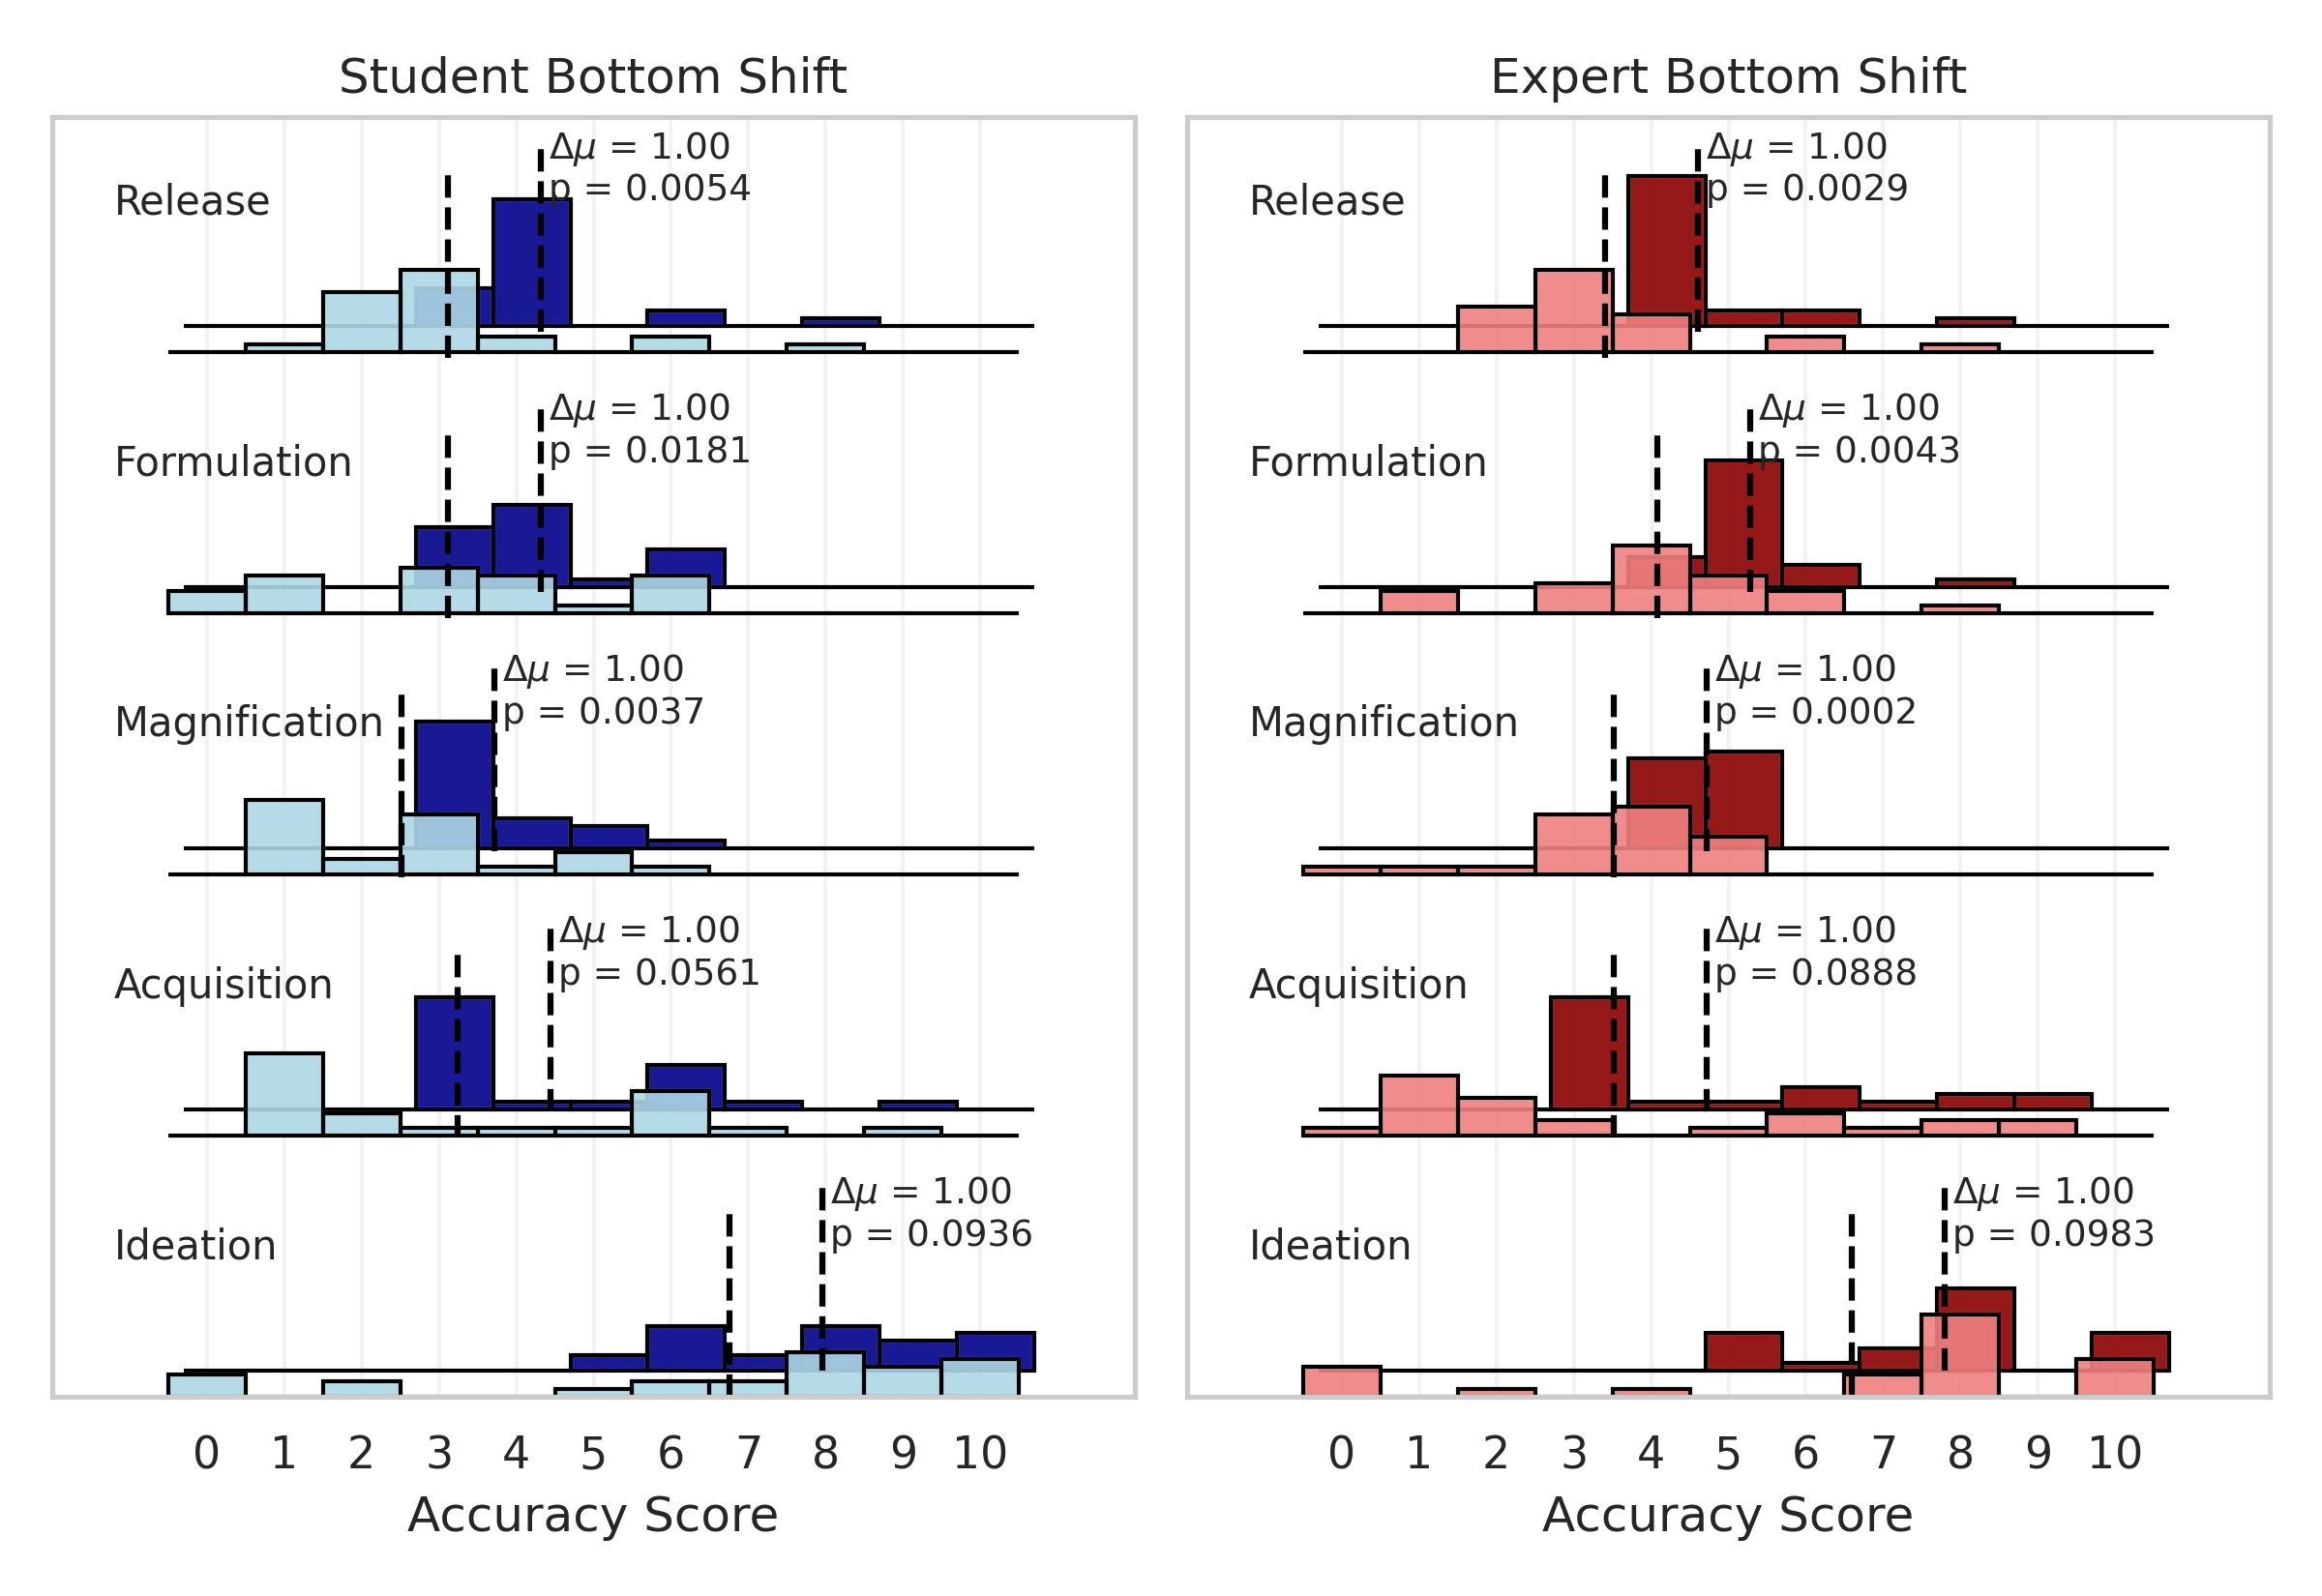
And it could work the other way too. Imagine biological weapons are so laughably easy to make that you would have to be a real idiot to fail. Well, a tool that helped real idiots but did not affect anybody else would increase risk by a fair margin (improving the odds from basically everyone being able to do it to definitely everyone being able to do it) without affecting the means by much. This would be especially concerning considering that most terrorists tend to be real idiots.
Again, we'll shift the distributions of students and experts without LLMs, but this time we will improve the scores of the bottom 20% of users. Now, the effects are larger for the mapping functions that assume lower scores are needed to pass stages.
Conclusion
Okay, obviously I made a lot of assumptions here. Those mapping functions, on which everything I wrote about kinda depends, have no basis in reality. I understand that the fact that I tried to correct for this by choosing six sets of mappings, each of which are equally arbitrary, does not suddenly make one of them relevant to reality. But I think it's a little telling that all of them support substantially increased risk in the LLM groups, and I feel like you would have to try pretty hard to find a mapping that doesn't support it (probably).
Also, there are some underlying weaknesses in the original study. For one, using expert-graded scores on an essay as a proxy for how good someone would be at making a biological weapon is problematic. Perhaps the LLMs just helped them write a cogent essay with some semblance of structure and without any glaring logical inconsistencies (which, from my experience grading undergraduate essays, would be huge for them) and that got them a good score. But maybe they don't help at all when you're actually in the lab with a pipette in your hand and a plate of unhappy cells at your bench. Or maybe they are super helpful in that context because you can send them pictures and troubleshoot in a conversational way that you can't with the internet. We kinda just don't know at this point.
All that to say, I think more research like this is needed. And not like how most academic papers use that phrase to mean "somebody at some point should check if this is right if they ever get the chance." I mean it in the sense of "we should figure this out ASAP before we go tearing open Pandora's Box and trying to immediately sell the contents on the Internet." I would like to see a test of people in wet labs doing stuff that is equivalently hard as making a biological weapon with and without LLMs. A sufficiently powerful study in this vein would avoid a lot of the admittedly speculative guesstimating of risk I engaged in here and just tell us what the percent increase in success probability actually is for some set of tasks.
In general, I think we should move away from statistical tests that just check if LLMs have any appreciable benefits to biological terrorists. I don’t think we should find it particularly surprising that LLMs will help with biological weapon acquisition and release. After all, they are helpful for writing Python code, choosing the right bathroom cleaners, and translating poetry into pirate-speak, so why wouldn’t they be helpful here? The question is how much will they help and will that amount of help push biorisk into fundamentally new levels of danger?
From the (admittedly paltry) evidence currently available, I would argue that “fundamentally new levels of danger” is not off the table.
Thanks for reading! I made a website for you to play around with some of these equation forms and distributions. Check it out here!